
Work breakdown structure and associated Gantt Chart
Define and manage the work breakdown structure of a project in a tree-grid and an associated Gantt Chart that supports drag and drop operations to enable in place task scheduling. Tasks are automatically scheduled, based on their dependencies, that can be easily defined using drag and drop operations either directly from the chart area or by typing predecessor indexes in a grid cell.
You may also set baselines and visually compare them to the actual task values anytime later.


Resource assignments
Assign resources to tasks using a separated interface, although simple assignments can also be created for tasks using a specific drop down list available within the work breakdown structure grid (presented in the previous section).
Schedule Chart
View and update resources and their usage in a comprehensive Schedule Chart that supports vertical drag and drop operations to enable in place task assignment updates. To execute this operation hover the bottom of the assignment bar, and perform the vertical drag only when a dotted line appears indicating assignment selection.
Designed this way, we ensure that mixing of horizontal and vertical drag operations is avoided, and provide better user experience.

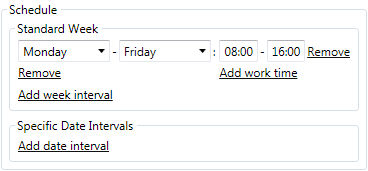
Project calendar
For each project you can define working days of a week, working hours of a day, and working and nonworking time exceptions such as holidays or lunch breaks, using the Schedule section of the Project Details tab in the main window of the application. The output schedule is synchronized to Gantt Chart and all other views automatically.
Load Chart and resource leveling
View resource availability and allocation information in a simple Load Chart. A specific algorithm for leveling resource allocations by rescheduling project tasks accordingly is also available from all chart views in the application.

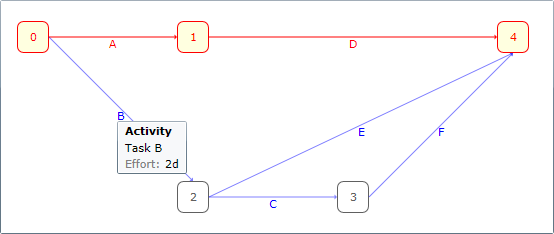
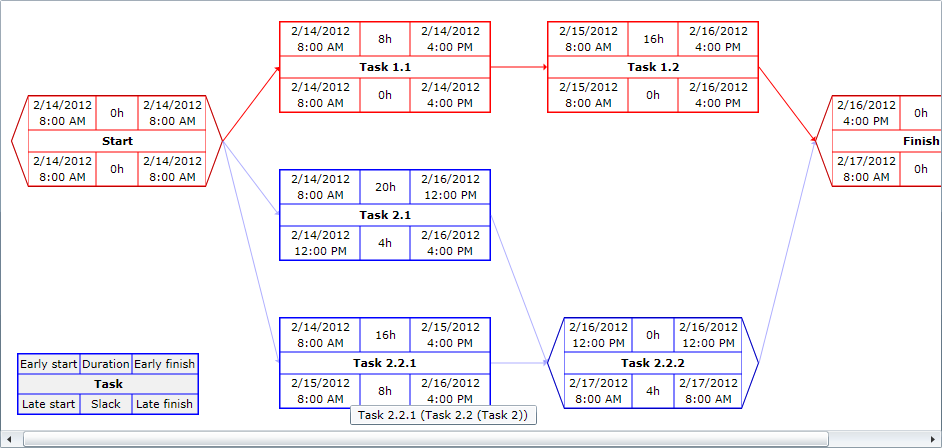
Highlighting critical paths with PERT Charts and Network Diagrams
Generate and print PERT Chart and network diagram sheets, automatically highlighting the project critical path items for further reference, whenever needed.
The statistical data for a project, including estimated effort, finish date, and total cost, is available in the Project Details whenever needed.

Features
Complex features
Configure and manage tasks, dependencies, resources and assignments, view critical paths, level resources, and print project data and charts with ease.
Customizable timeline
Customize working week and day time intervals, add nonworking time intervals as needed, and use multiple timeline scale types with appropriate header interval formatting.
Share and have fun
Save project files anywhere and share them with anyone: they can be always opened with the public viewer application available for free. Export Microsoft® Project XML files as well.