DlhSoft, 2023
Schedule Chart and Load Chart – resources
Dependencies and auto-scheduling
Project Manager 20 allows you to create and edit projects defined as lists of work items (also known as tasks) and their inner-dependencies, and resource assignments and allocations. Projects can be saved as Microsoft Project-compatible .xml files.
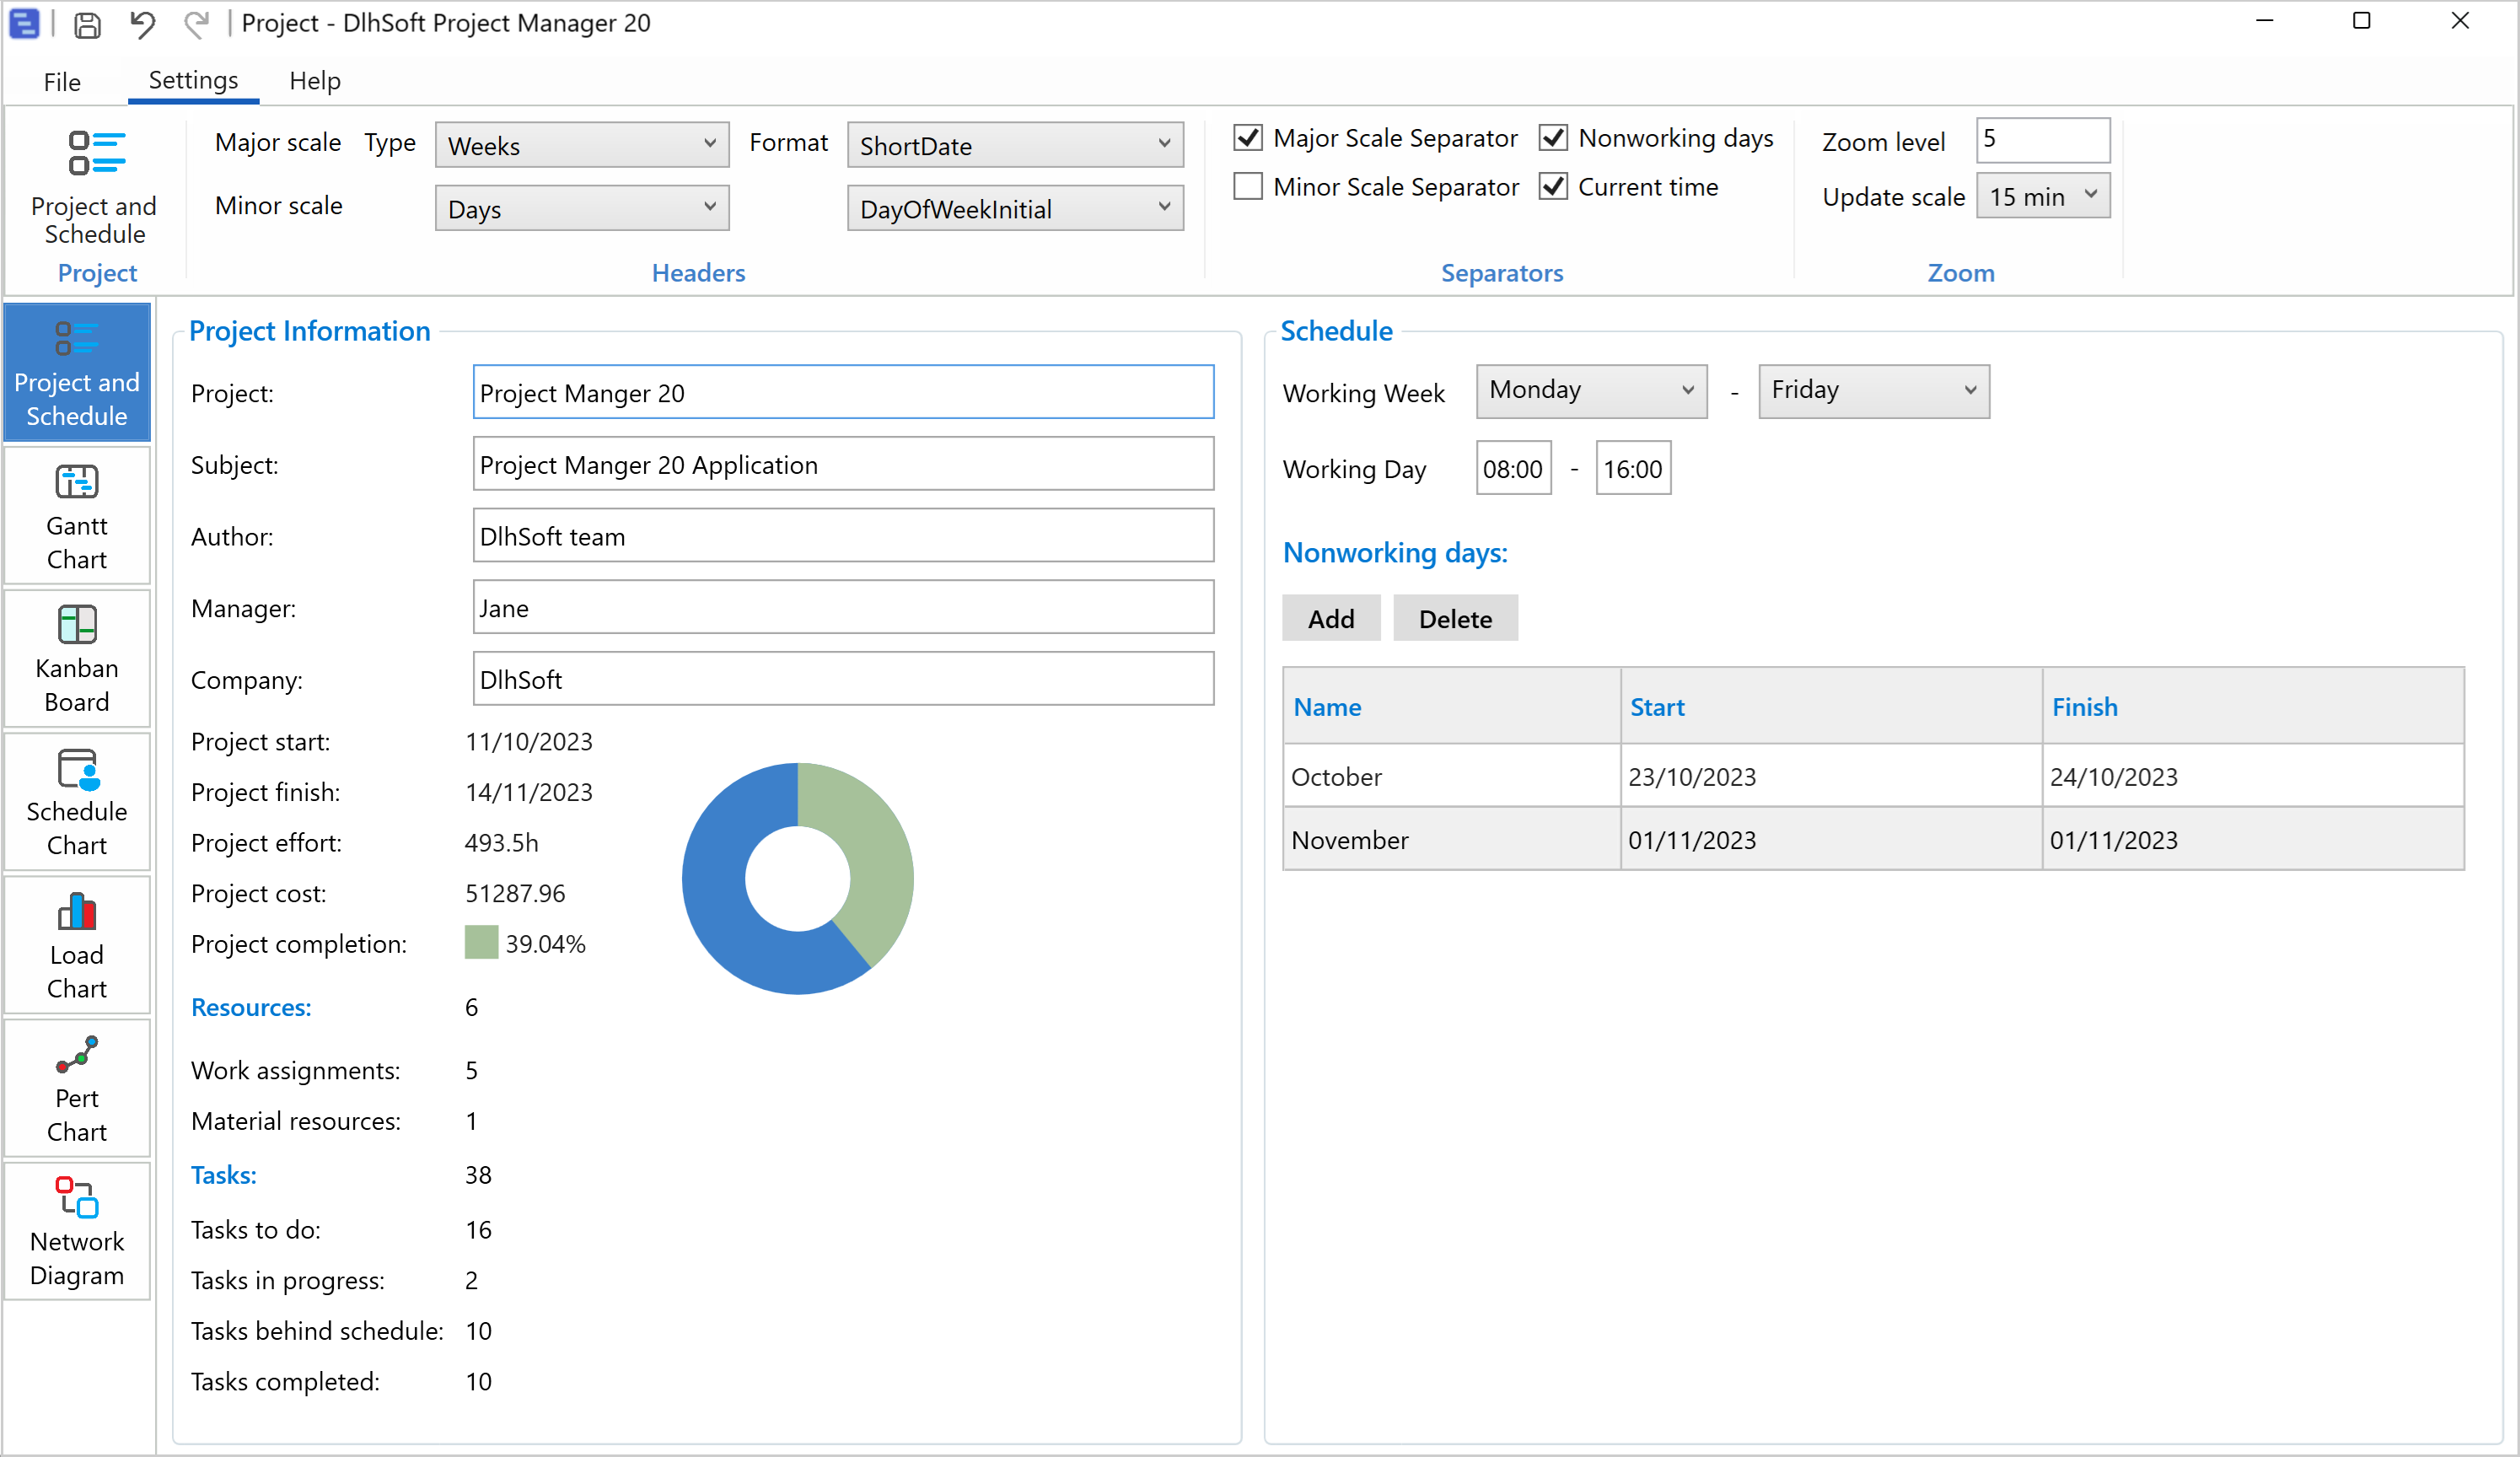
In the Project and Schedule screen you can edit project properties like: name, project, author, manager or company, and define the work schedule to be used for the project (hours of day, days of week, and holidays). In Gantt charts nonworking time will be presented using gray background.
Some statistics and pre-computed information are also available: project start, finish, total effort, and cost, and as well project completion percent. Specific counters regarding project tasks and assigned resources are displayed here, too.

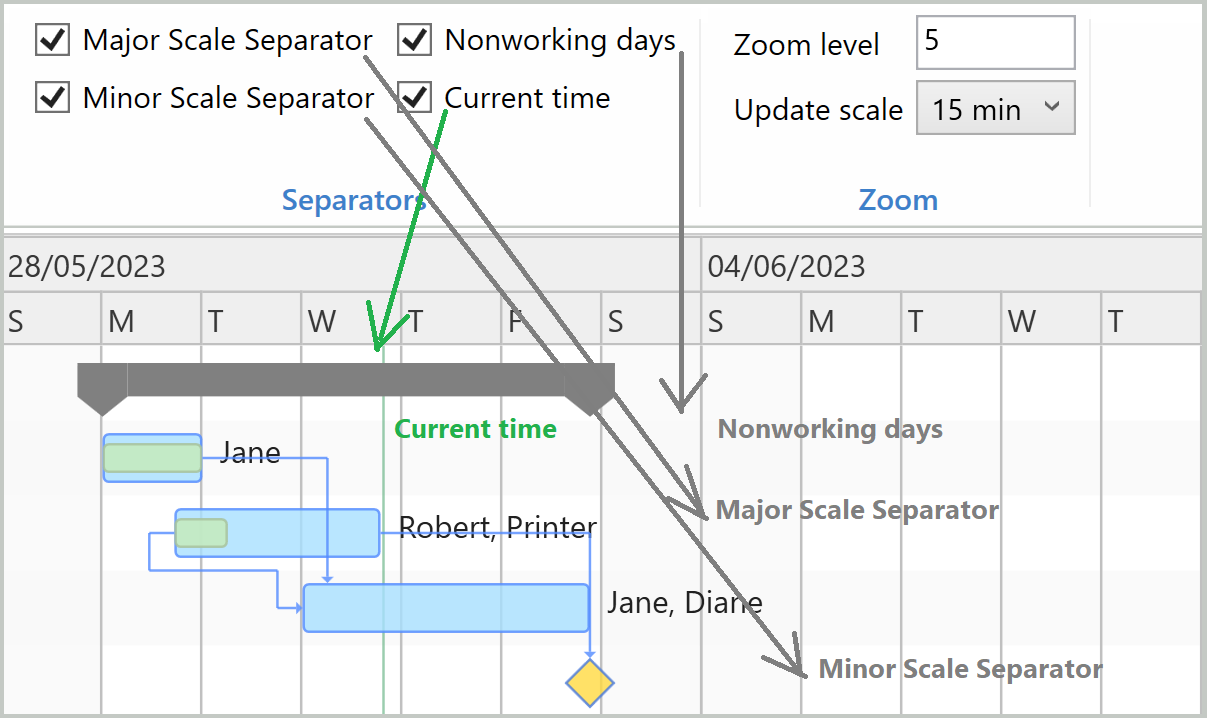
From the Settings ribbon, depending on your specific needs, you can specify the headers to use in chart areas yourself.

Each chart header will have two lines, name the Major Scale and Minor Scale. The default type for Major Scale is Weeks and for the Minor Scale it is Days. Using the drop-down and checkbox controls provided there, for each line, you can customize the diagram by selecting the types of scales and formatting you need for your project.
For any individual header line, these elements can be defined:
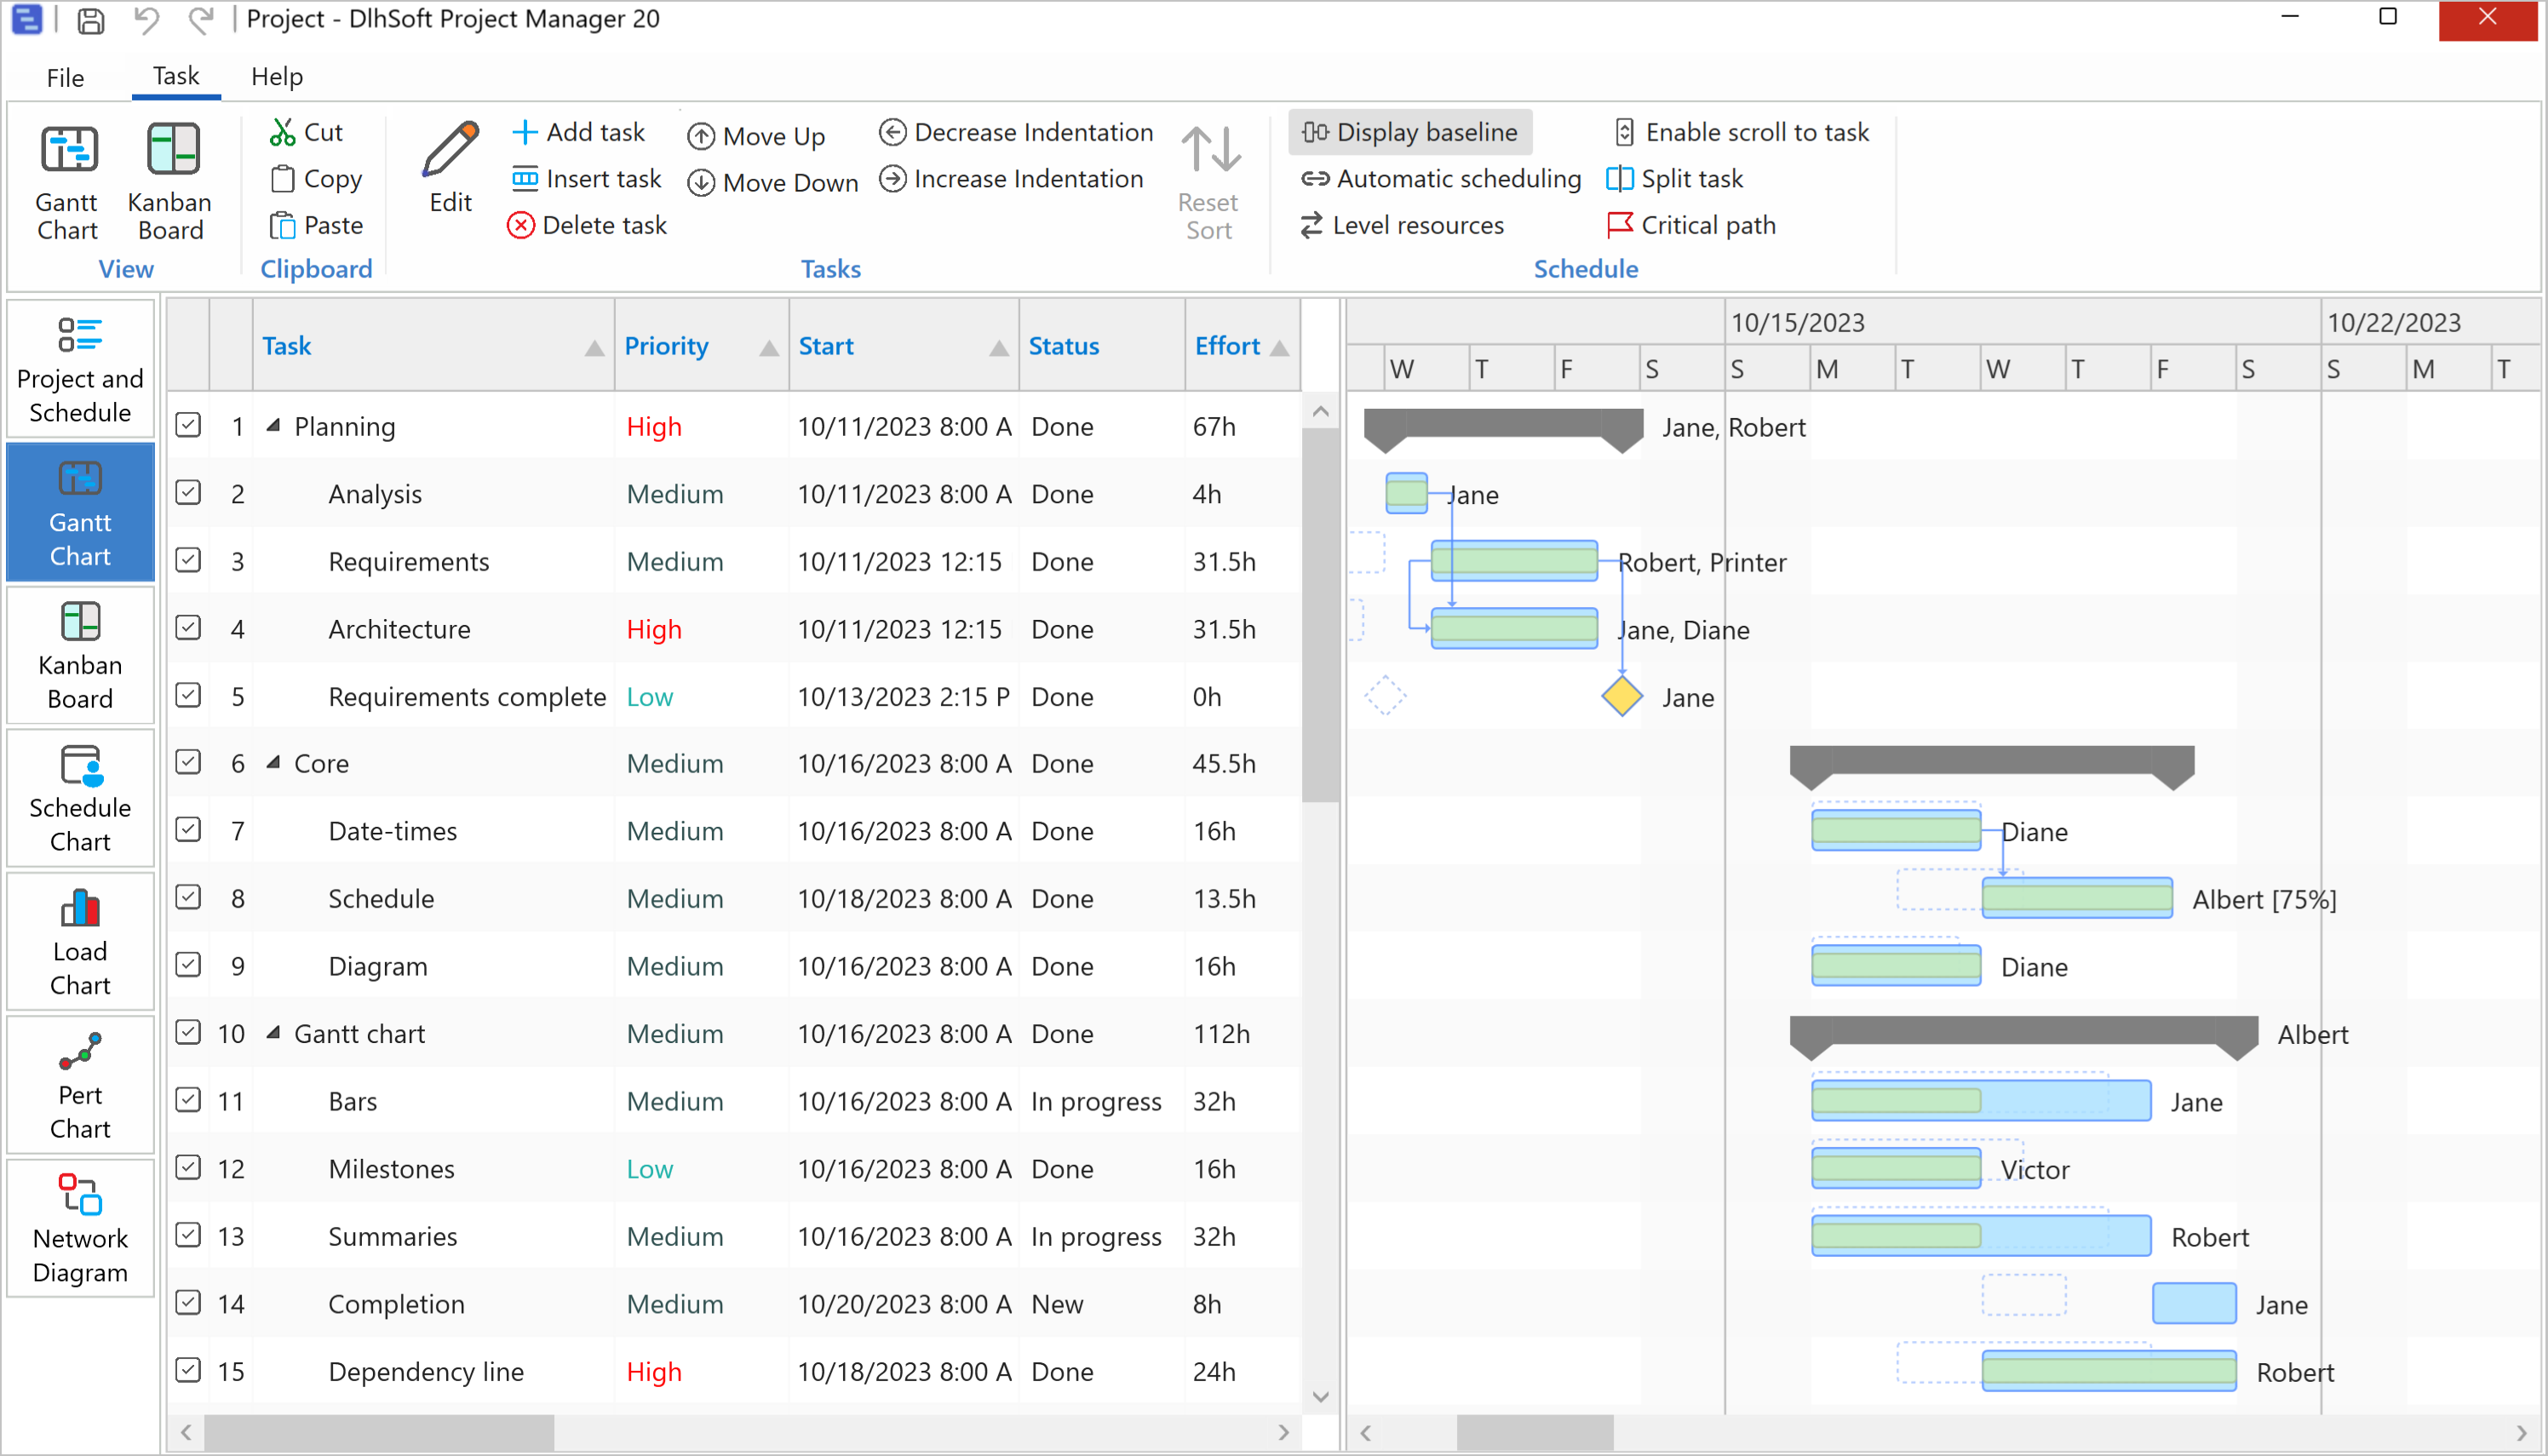
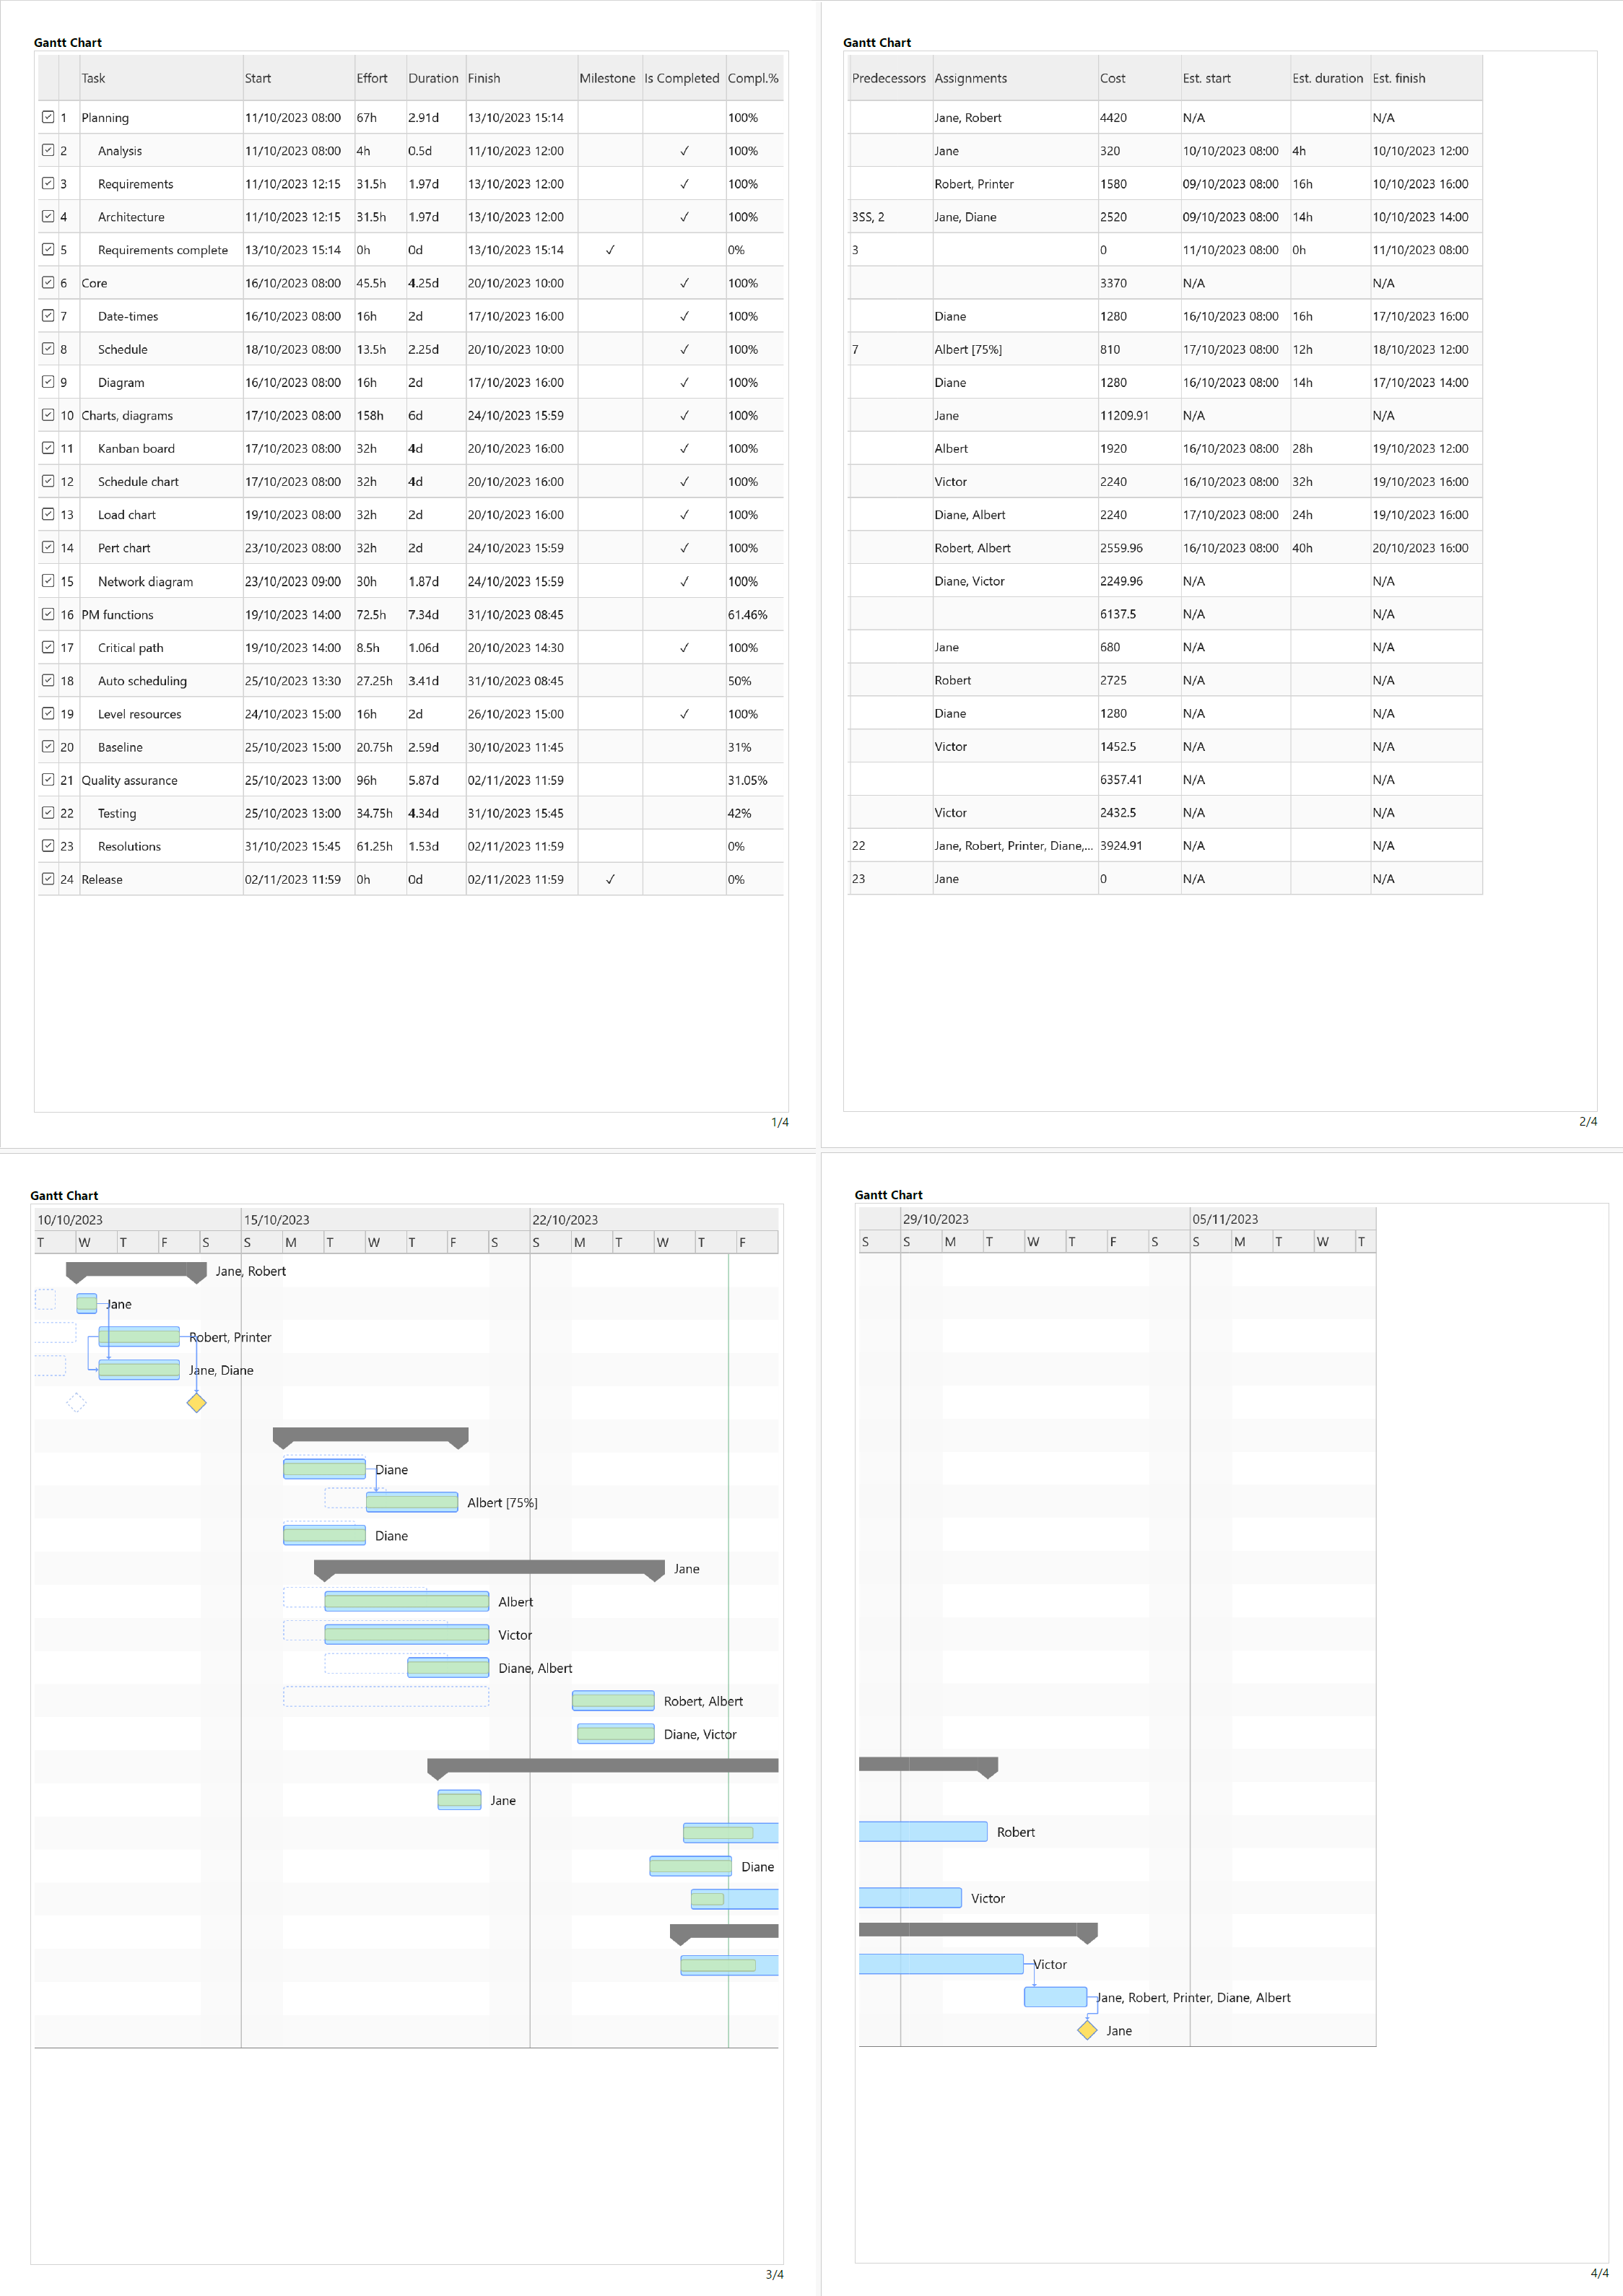
Project Manager 20 presents the list of tasks with a Gantt Chart representation, including their dependencies and resource assignments.
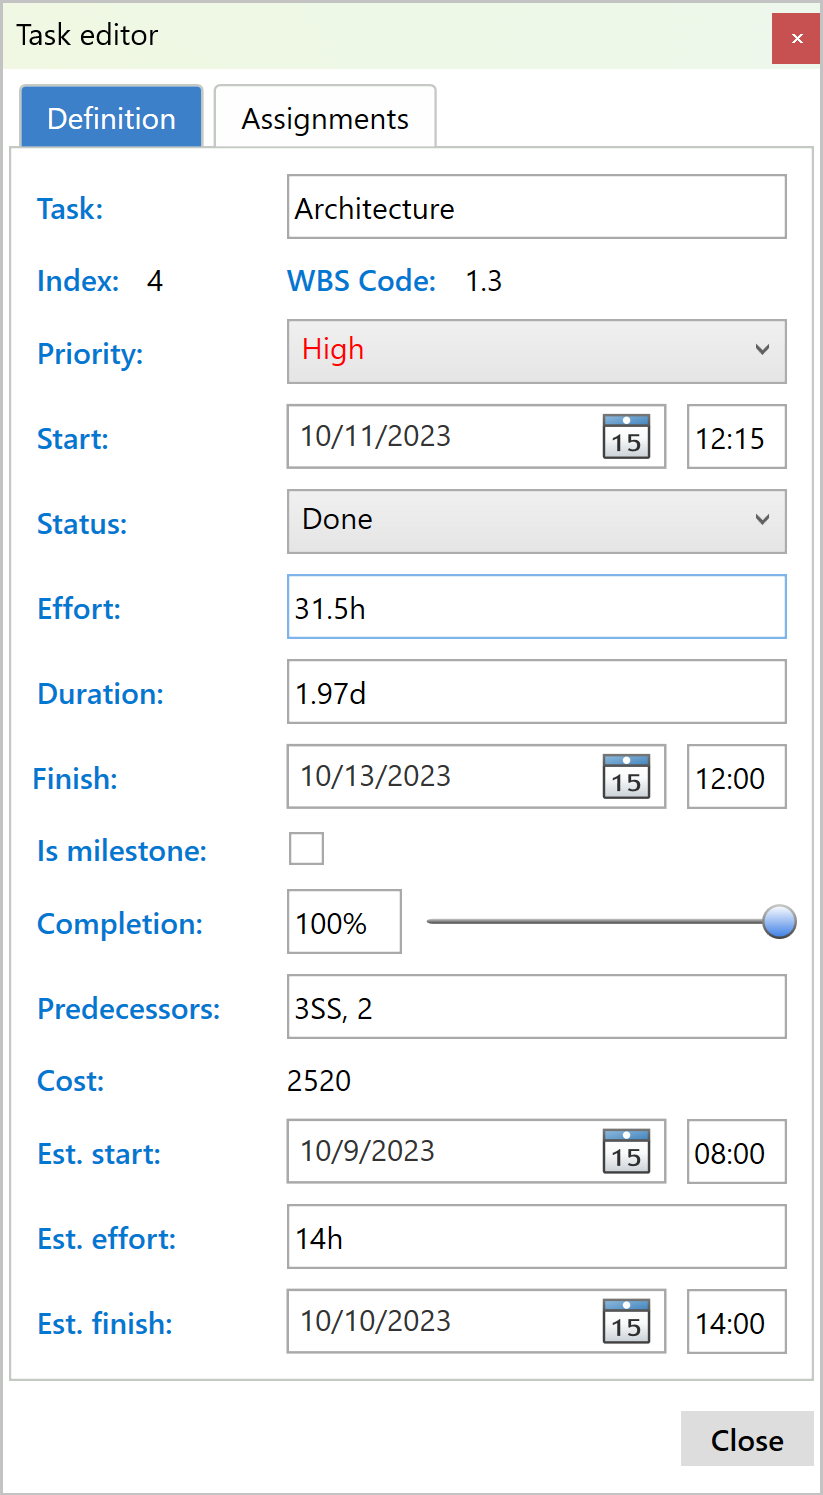
When a project file is open, tasks are displayed in an outline view as well as bars within a synchronized Gantt chart presented in the main area of the screen. You can update task values directly in the grid, in an Edit dialog (open by clicking the pencil button in the ribbbon), or by performing drag and drop operations in the chart:
To add, insert and remove tasks you can use Add task, Insert task and Delete task buttons from the ribbon. Also, the order of the tasks can be modified with the Move Up and Move Down buttons. Increase Indentation and Decrease Indentation buttons are available as well, providing support for grouping tasks under summary items, as needed.
Tasks are defined by these main fields:
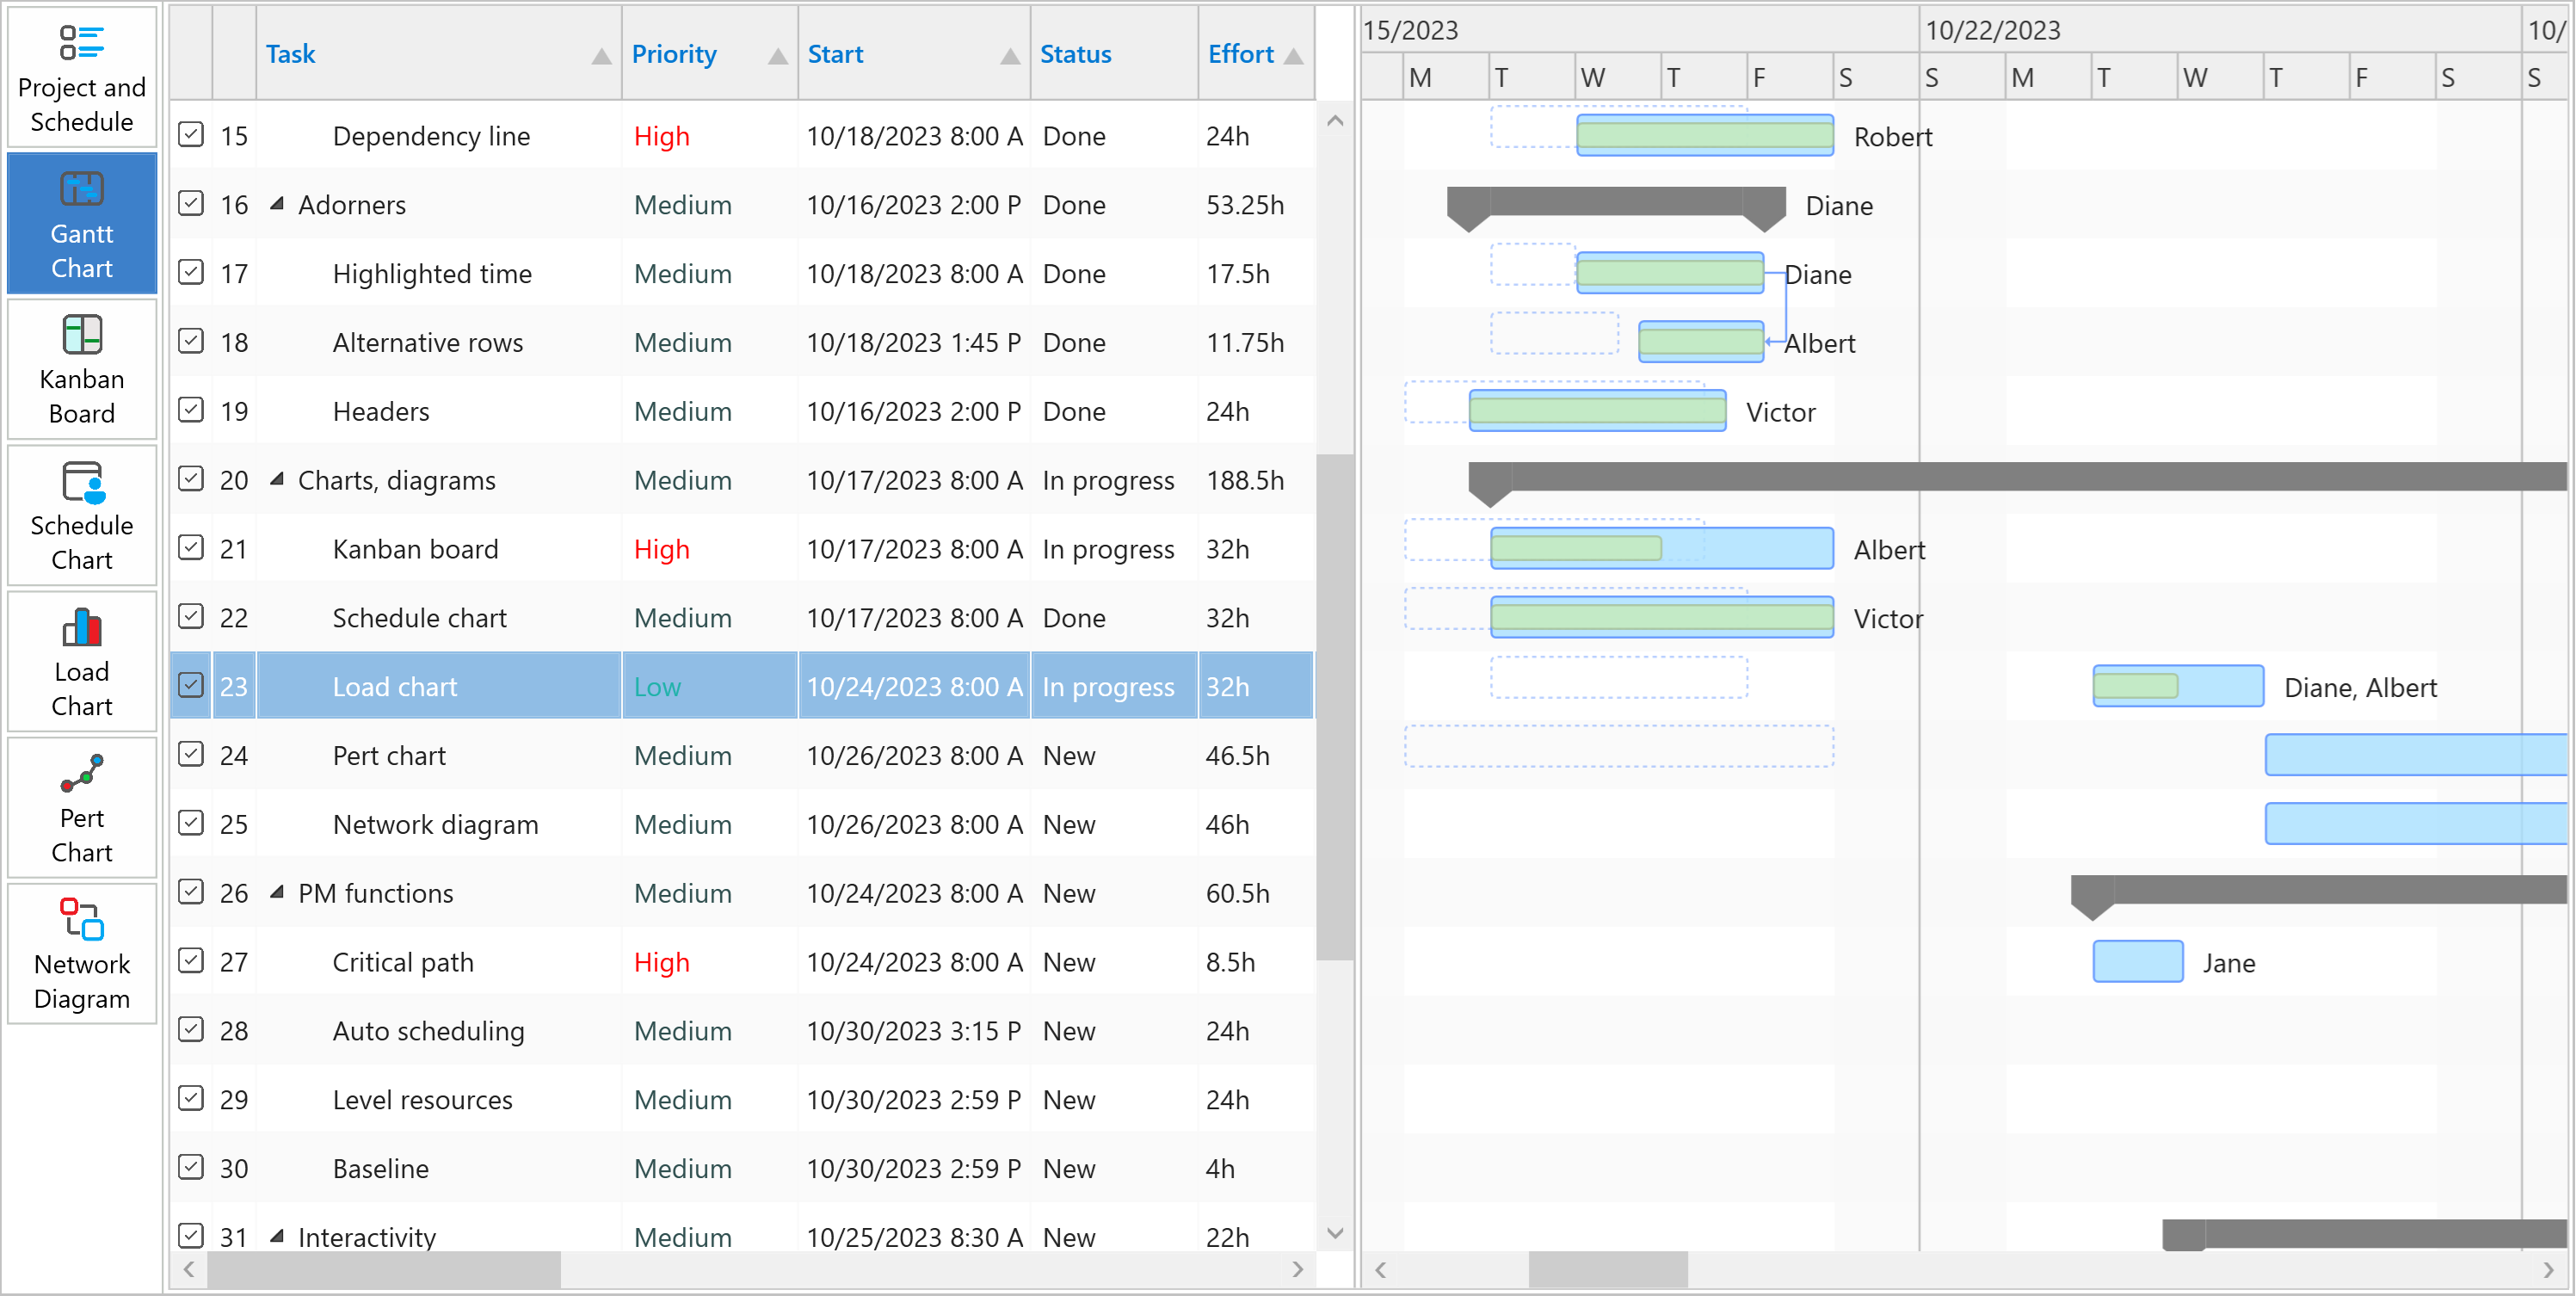
A project stores tasks as a hierarchy, exposed in the left grid using corresponding expand and collapse buttons (expanders).
Sorting is possible by clicking on the triangle on the right side of the columns. Most columns have implemented this functionality. If we want to return to the order before sorting, press the "Reset Sort" button. Sorting is implemented in Gantt, Kanban Board (from toolbar), Schedule and Load Chart.
The effort value of a standard task is computed considering all its resource assignments. For example, if both Jane and Diane are assigned to the task while Diane is allocated with a 50 percent limit and the task spans for 2 working days (16 hours), its computed effort will be: 24 hours (multiplying 16 hours by 1.5 allocation units.)
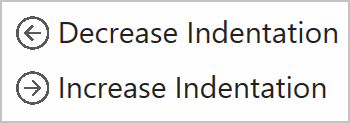
Summary tasks can be configured by increasing and decreasing the indentation level of individual items using the left and right arrow buttons from the ribbon, and are used to group and automatically compute information (such as start and finish values) based on their child items.
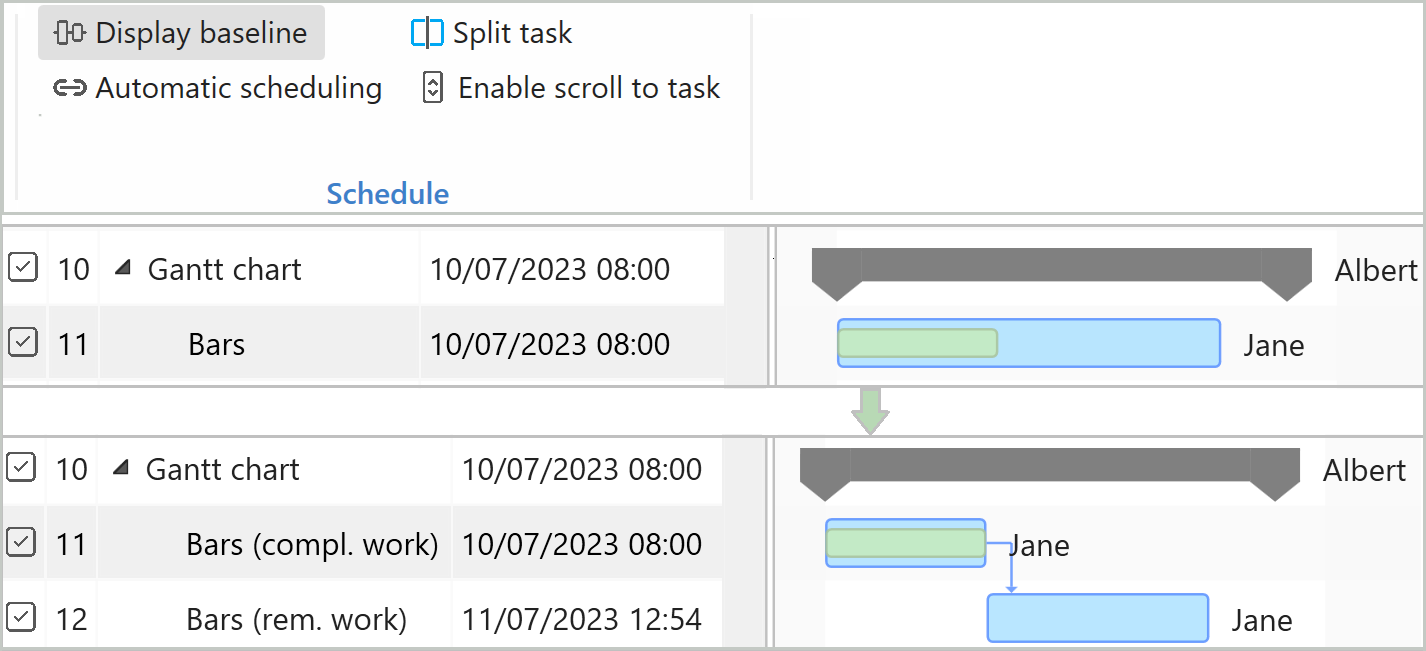
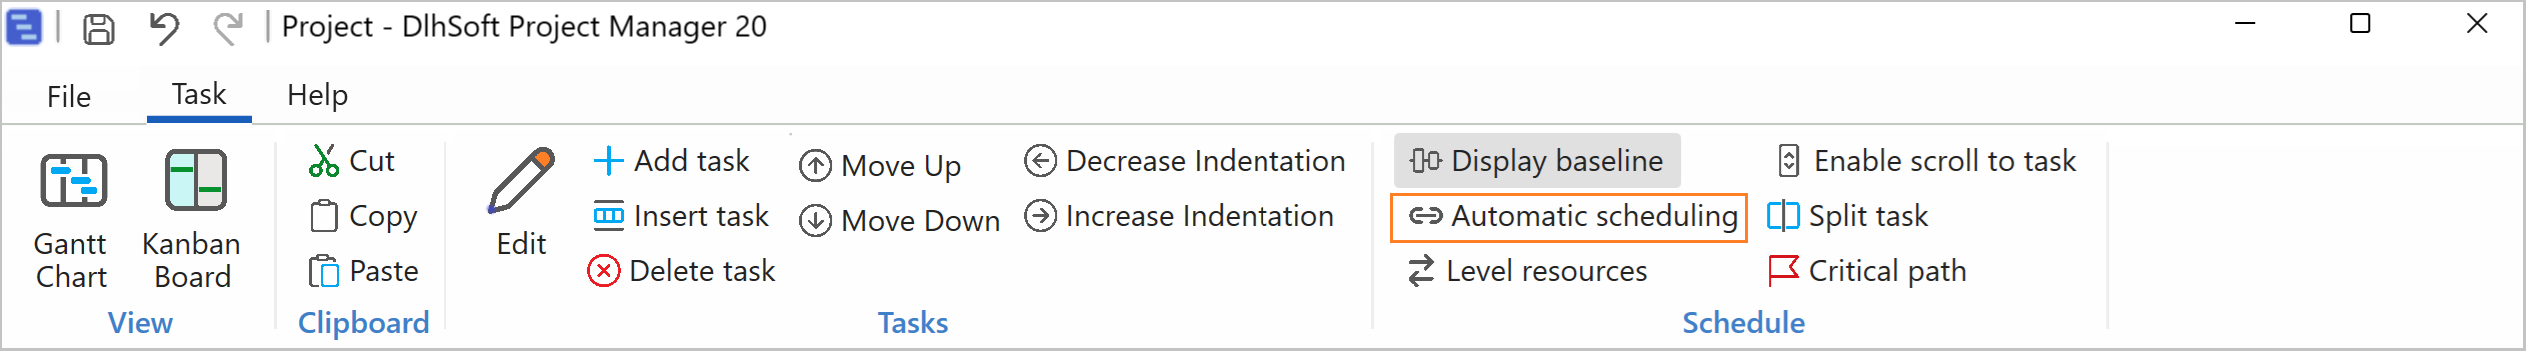
Display baseline button is enabled by default. If Est. start and Est. finish fields from the task are set, a dashed line bar will be displayed in the chart area of the application, representing the estimation of that task.
Automatic scheduling may be enabled if needed; in that case, start and finish values of dependent tasks will be automatically updated when predecessors change.
By clicking the Split task button when a task in progress is selected, it would be splitted into two dependent tasks: the first one will be marked as completed, spanning the original completion duration, and the second one will be not started; this is useful, for example, to create interruptions between task parts.
Enabling the Scroll to task toggle button, one can turn on behavior that would in turn automatically scroll the timeline horizontally according to a selected task's start date (upon a click on the task's grid row).
Kanban Board view can be used to view tasks in different statuses grouped by their summary items, optionally filtered by date.
You can also edit task details directly from the Kanban view, of course. When you update values, they will automatically reflect in Gantt Chart view, and other views as well, when you navigate back to it/them.
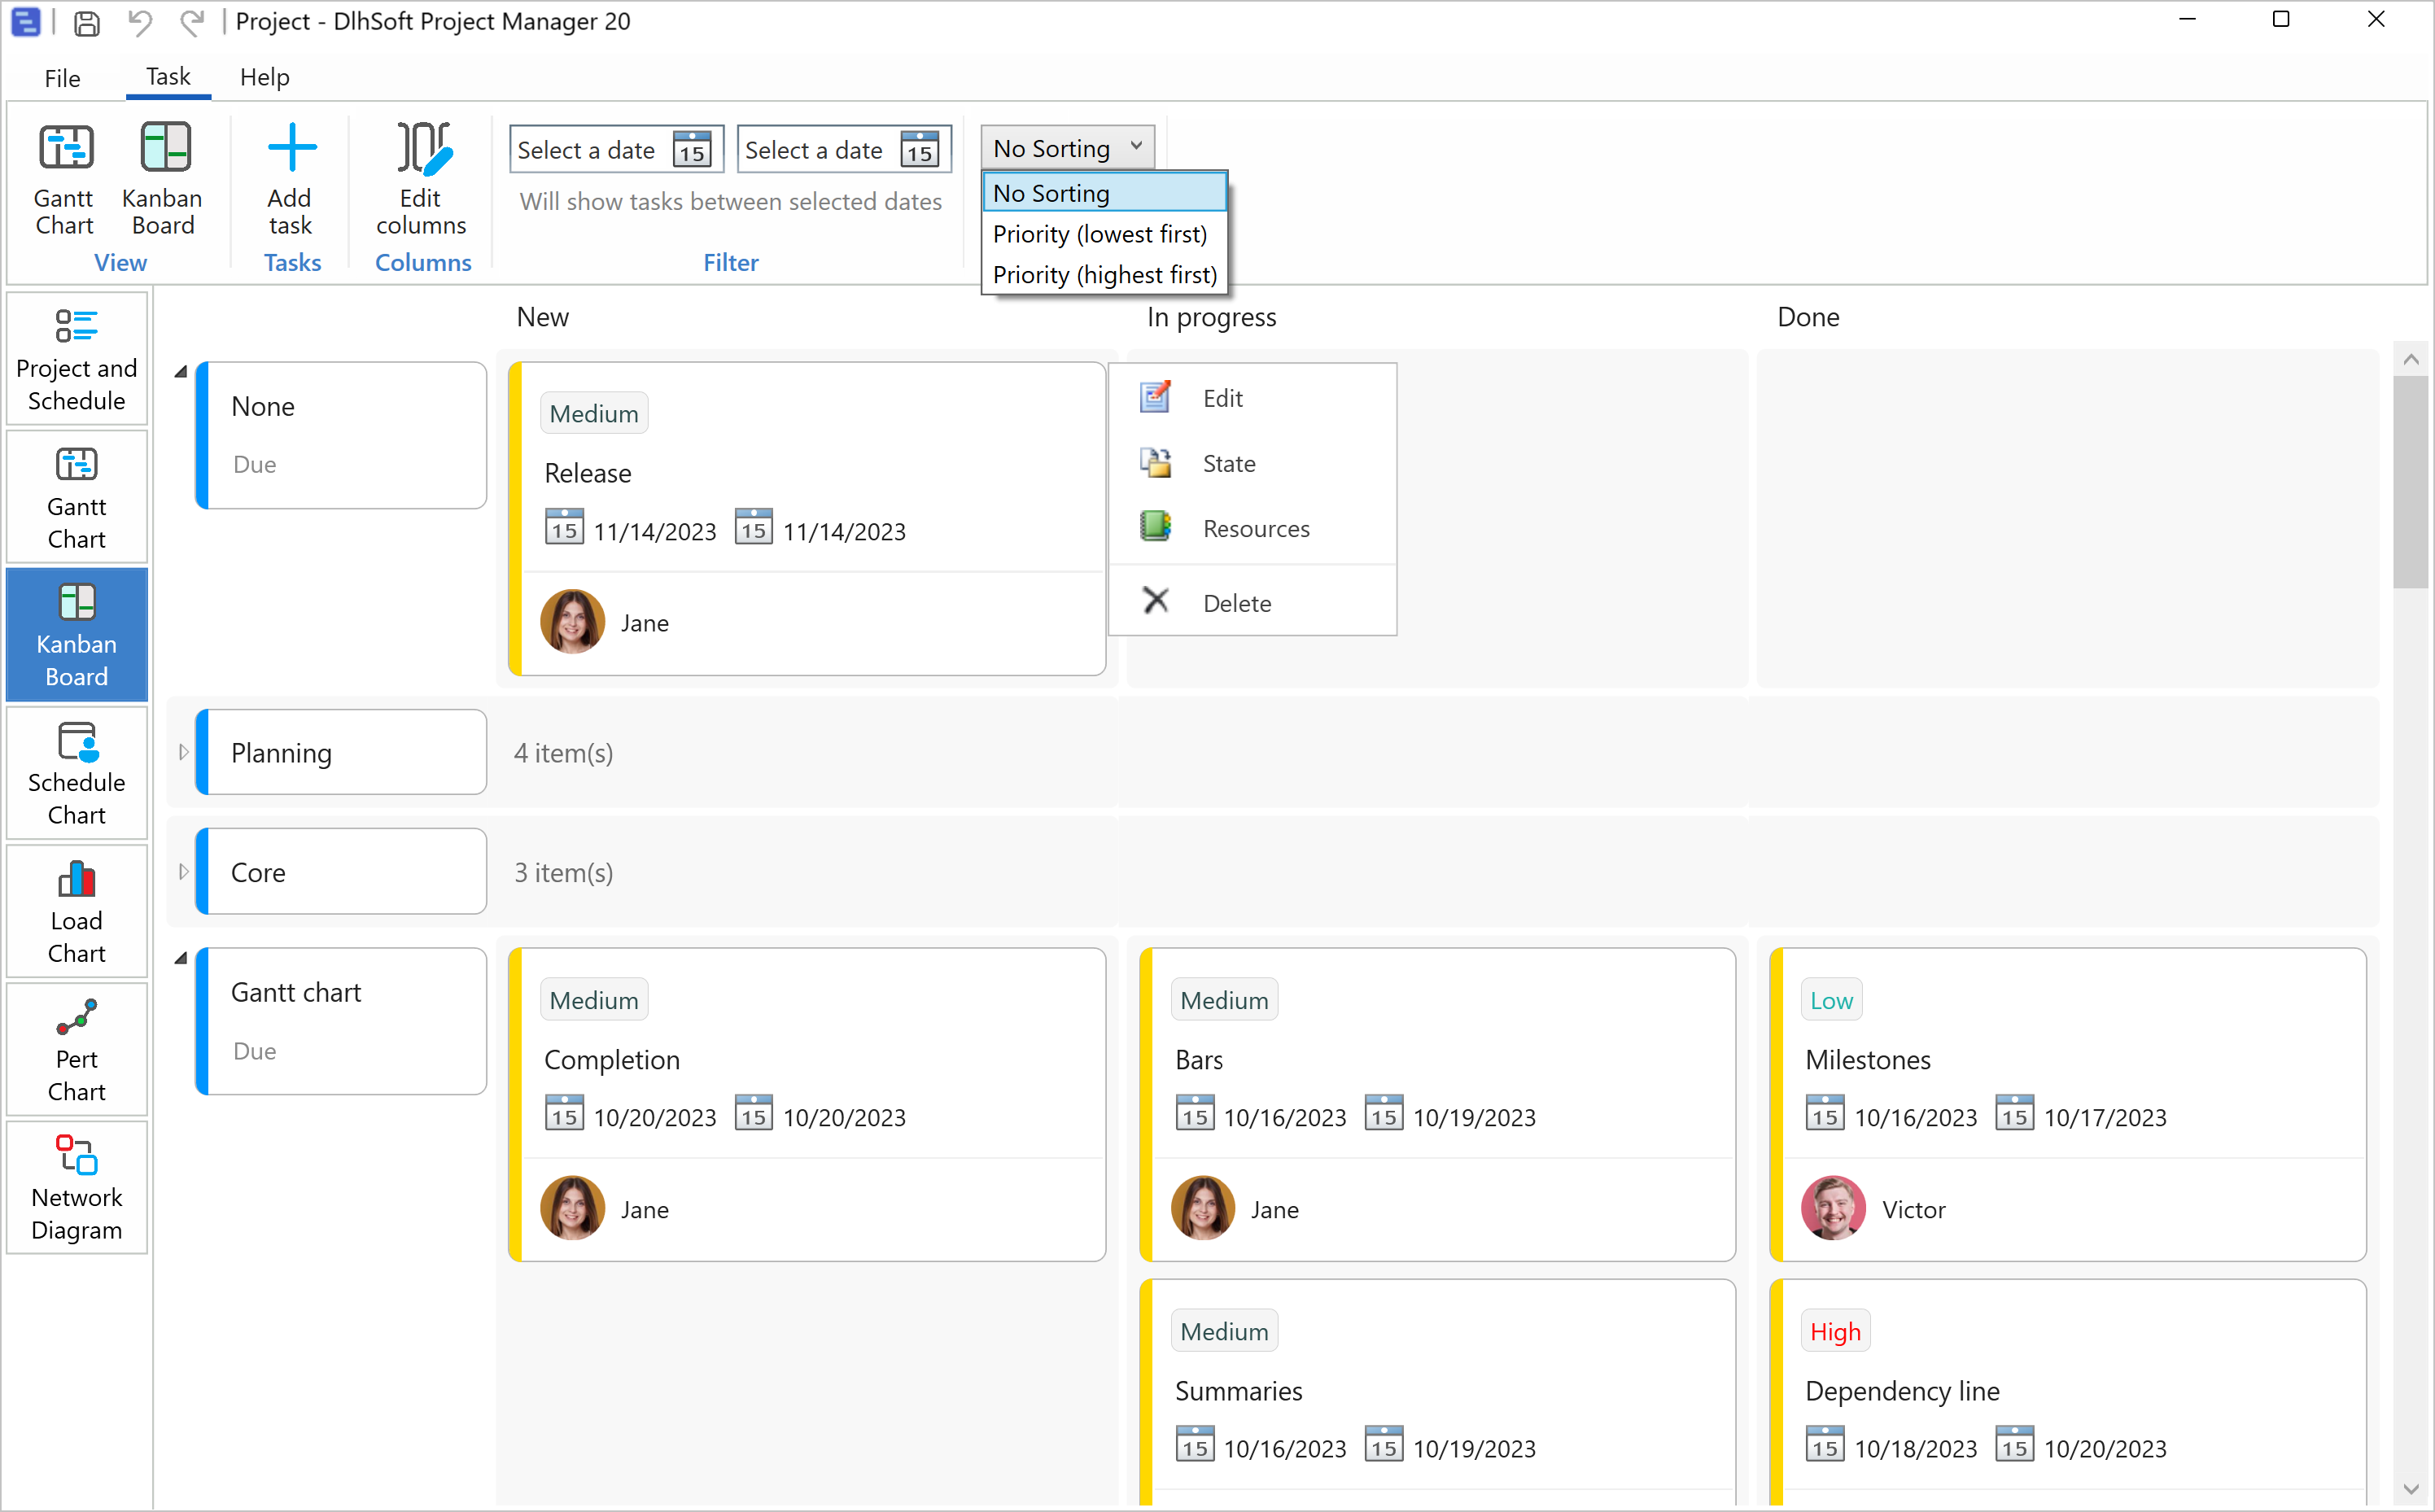
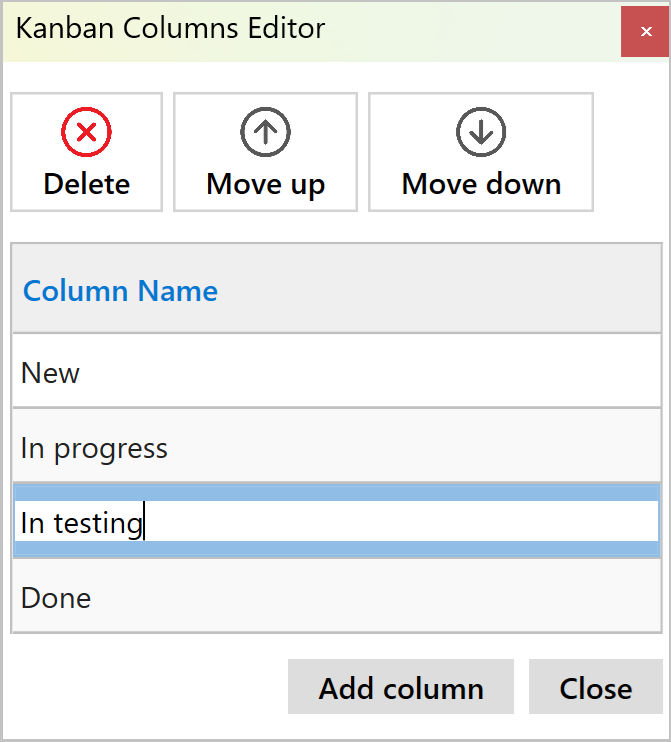
The columns in the Kanban Board can be edited by pressing the "Edit columns" button. New columns can be added by clicking the "Add column" button, located at the bottom of the window. Newly added columns can be moved or deleted. "New", "In progress", and "Done" columns can only be renamed.
The tasks in the Kanban Board can be sorted according to priority.
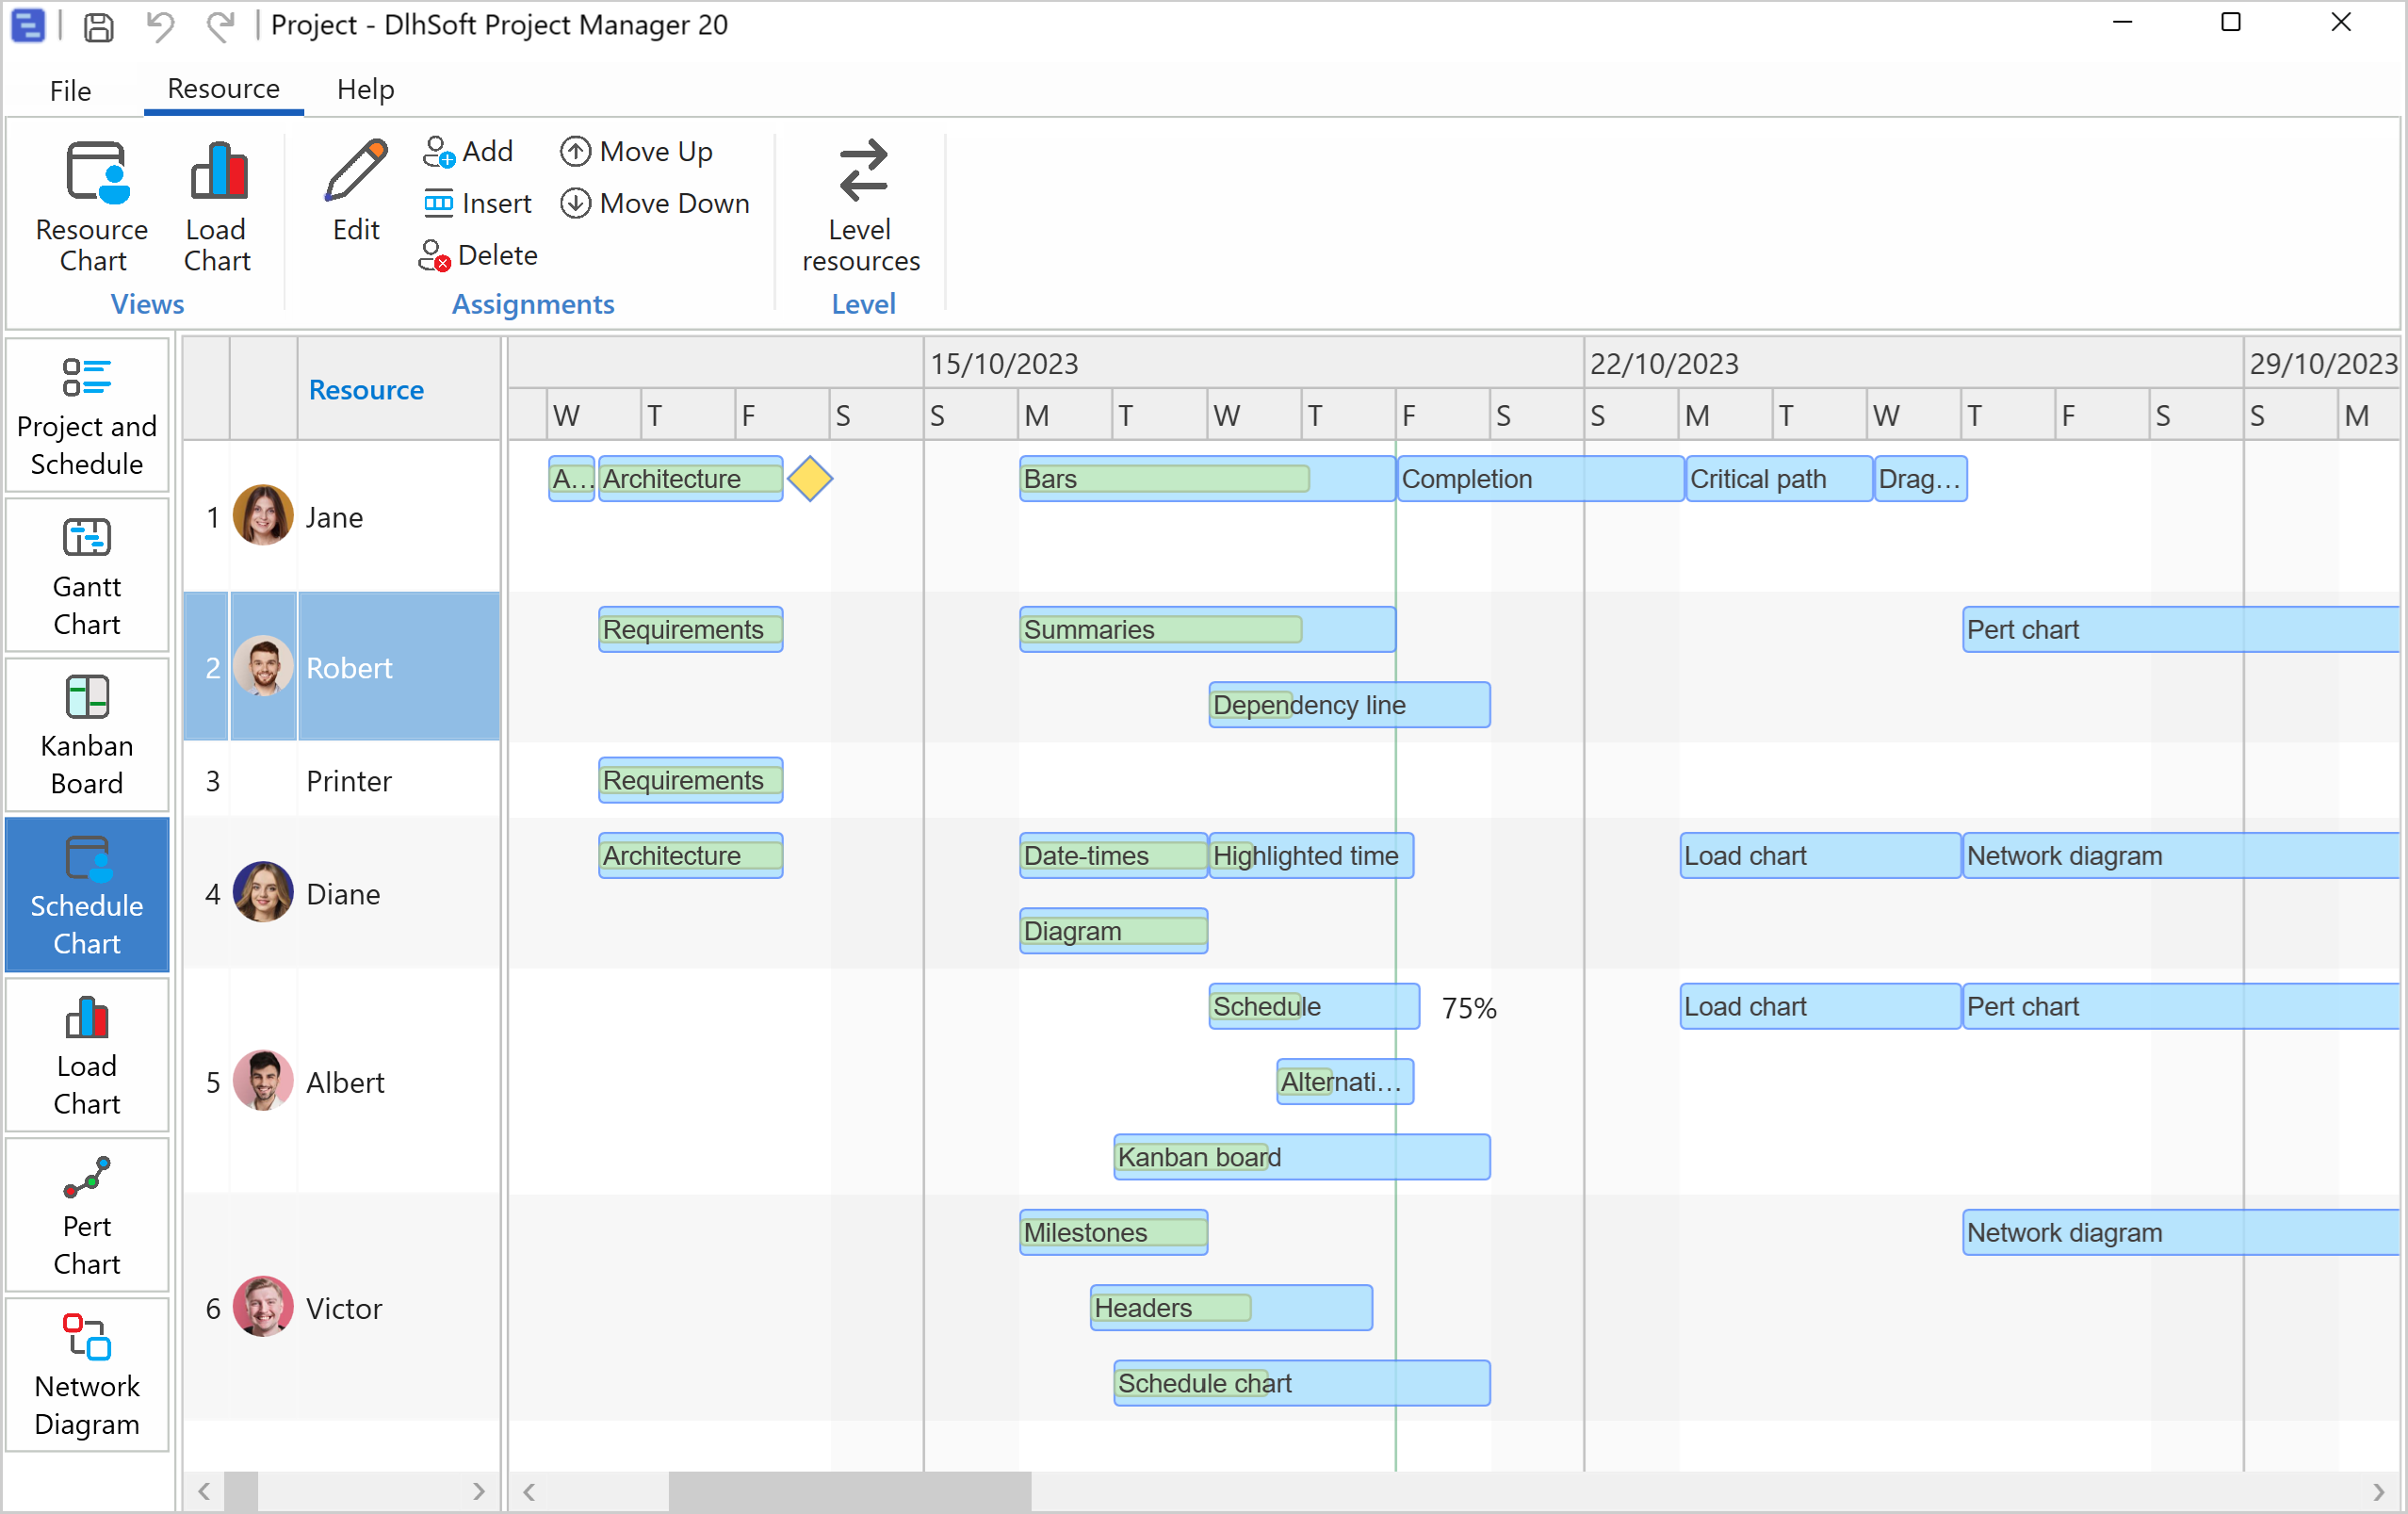
You can create and remove resources from the Schedule Chart view.
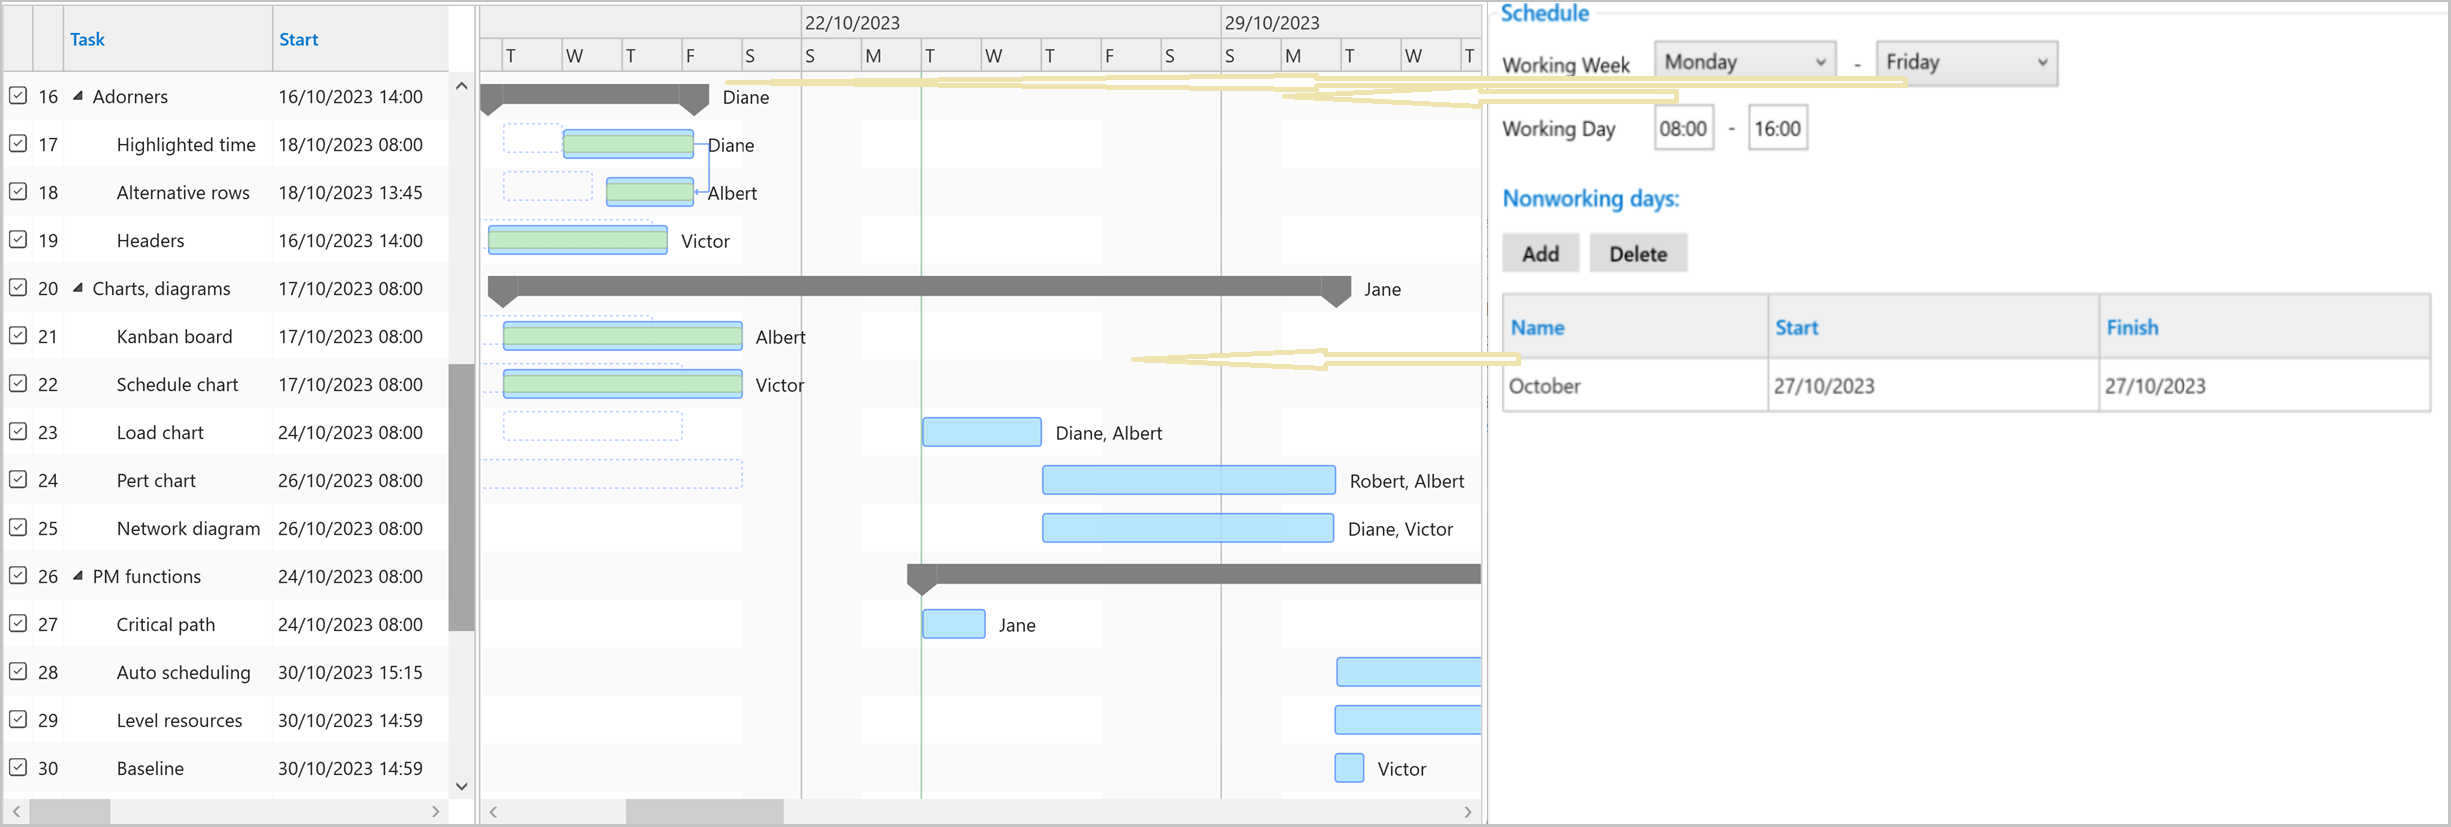
Schedule Chart view shows all tasks assigned to the same resource in the same row, so it's easy to understand how much work each resource has. Tasks can be moved from one resource to another using vertical drag operations, by simply holding their bars from their bottom areas.
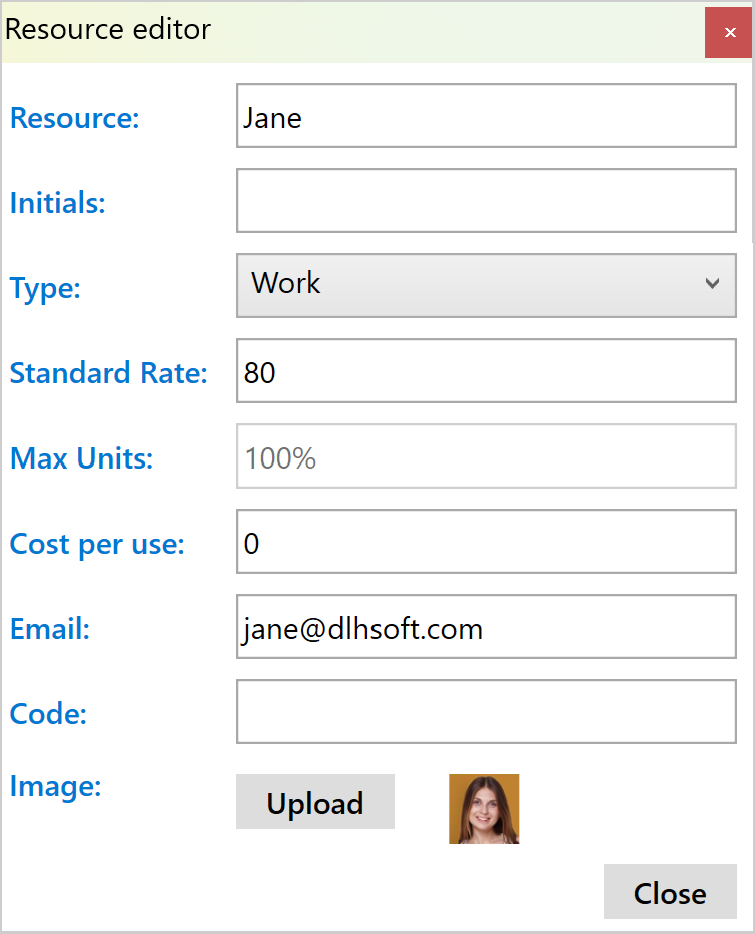
From Schedule chart view you can also create new resources, defining their names, e-mail address, code, type, standard rate (for work typed resources) or cost per use (for materials) and availability (in percentual units). The overall cost, considering all assigned tasks of each resource is also automatically calculated and shown as the Cost column in the grid.
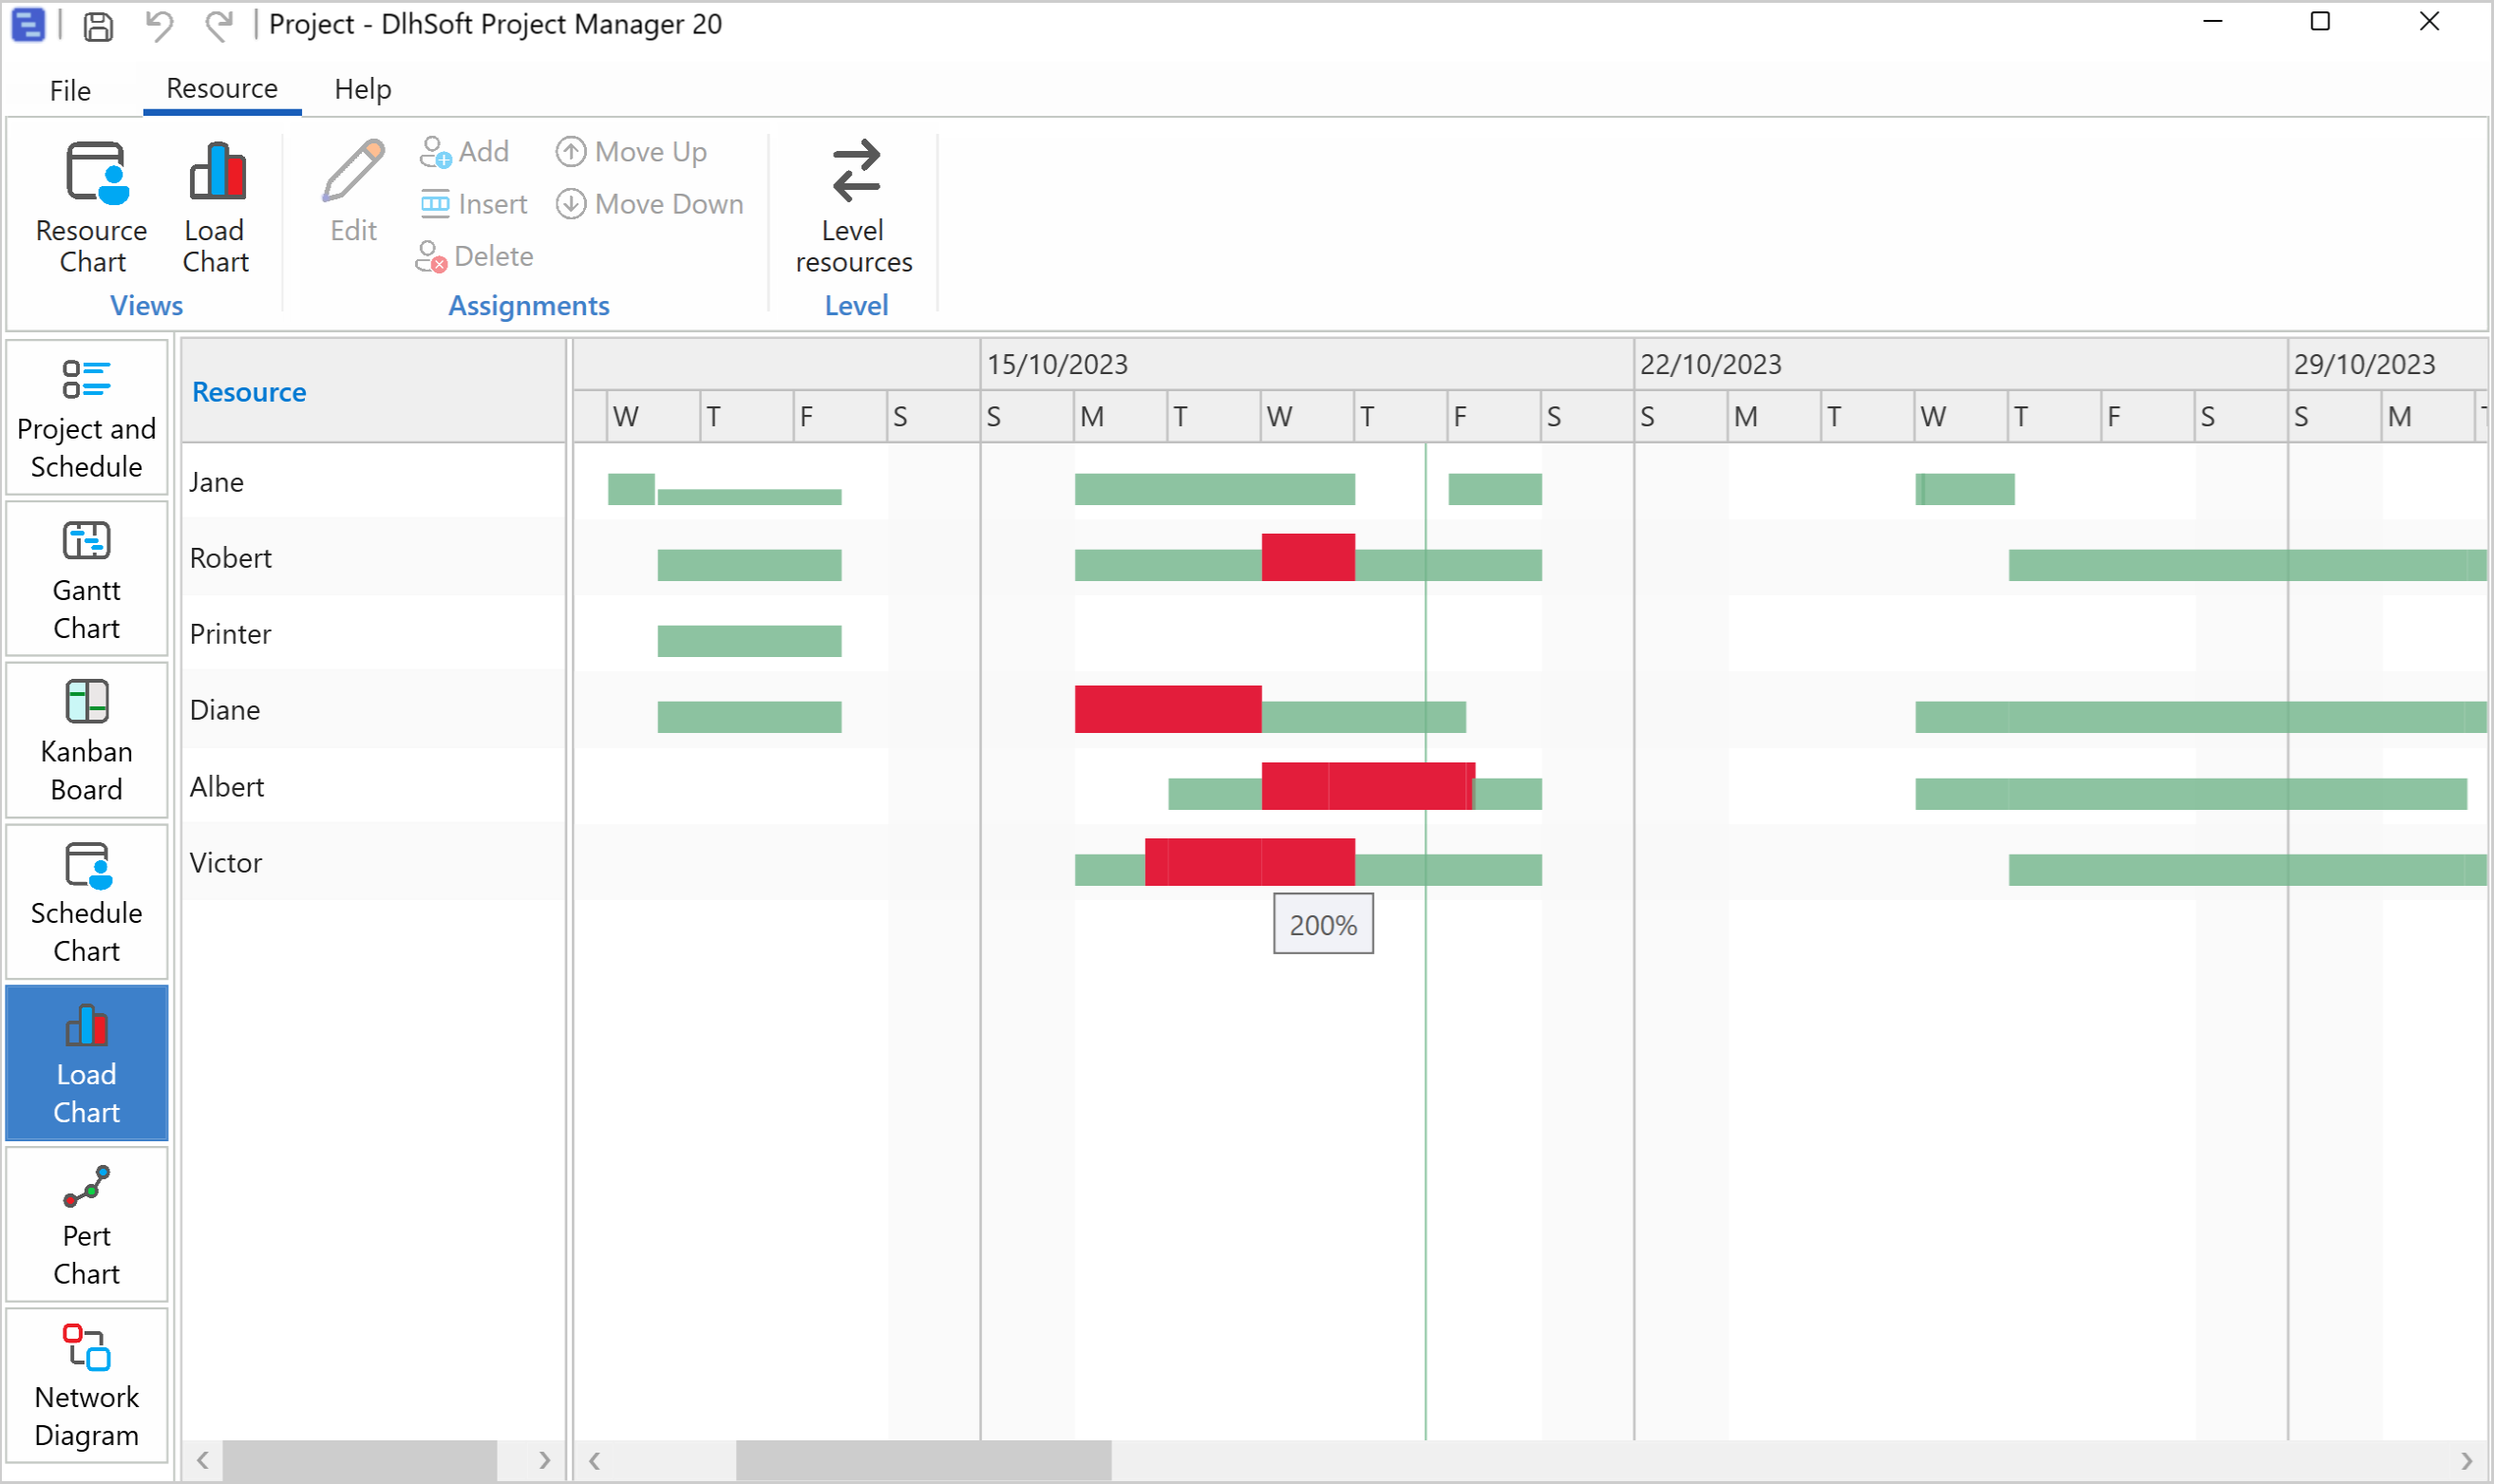
Load Chart view displays a diagram that shows how much work each resource has during the project's time. If a resource has too much work (more than 100% allocated), the amount will be highlighted, too, to easily spot bottlenecks.
Besides editing the Predecessors field of a task in the Gantt Chart (which also supports entering lead or lag information by appending positive or negative values, in hours), you can create dependencies between items by simply dragging to draw dependency lines from one bar to another directly in the chart area. To remove a dependency, use the Delete command from the context menu of its line.
These dependency types are supported:
You can optionally turn on Auto-scheduling mode to ensure all dependencies are respected even when predecessor tasks are rescheduled.
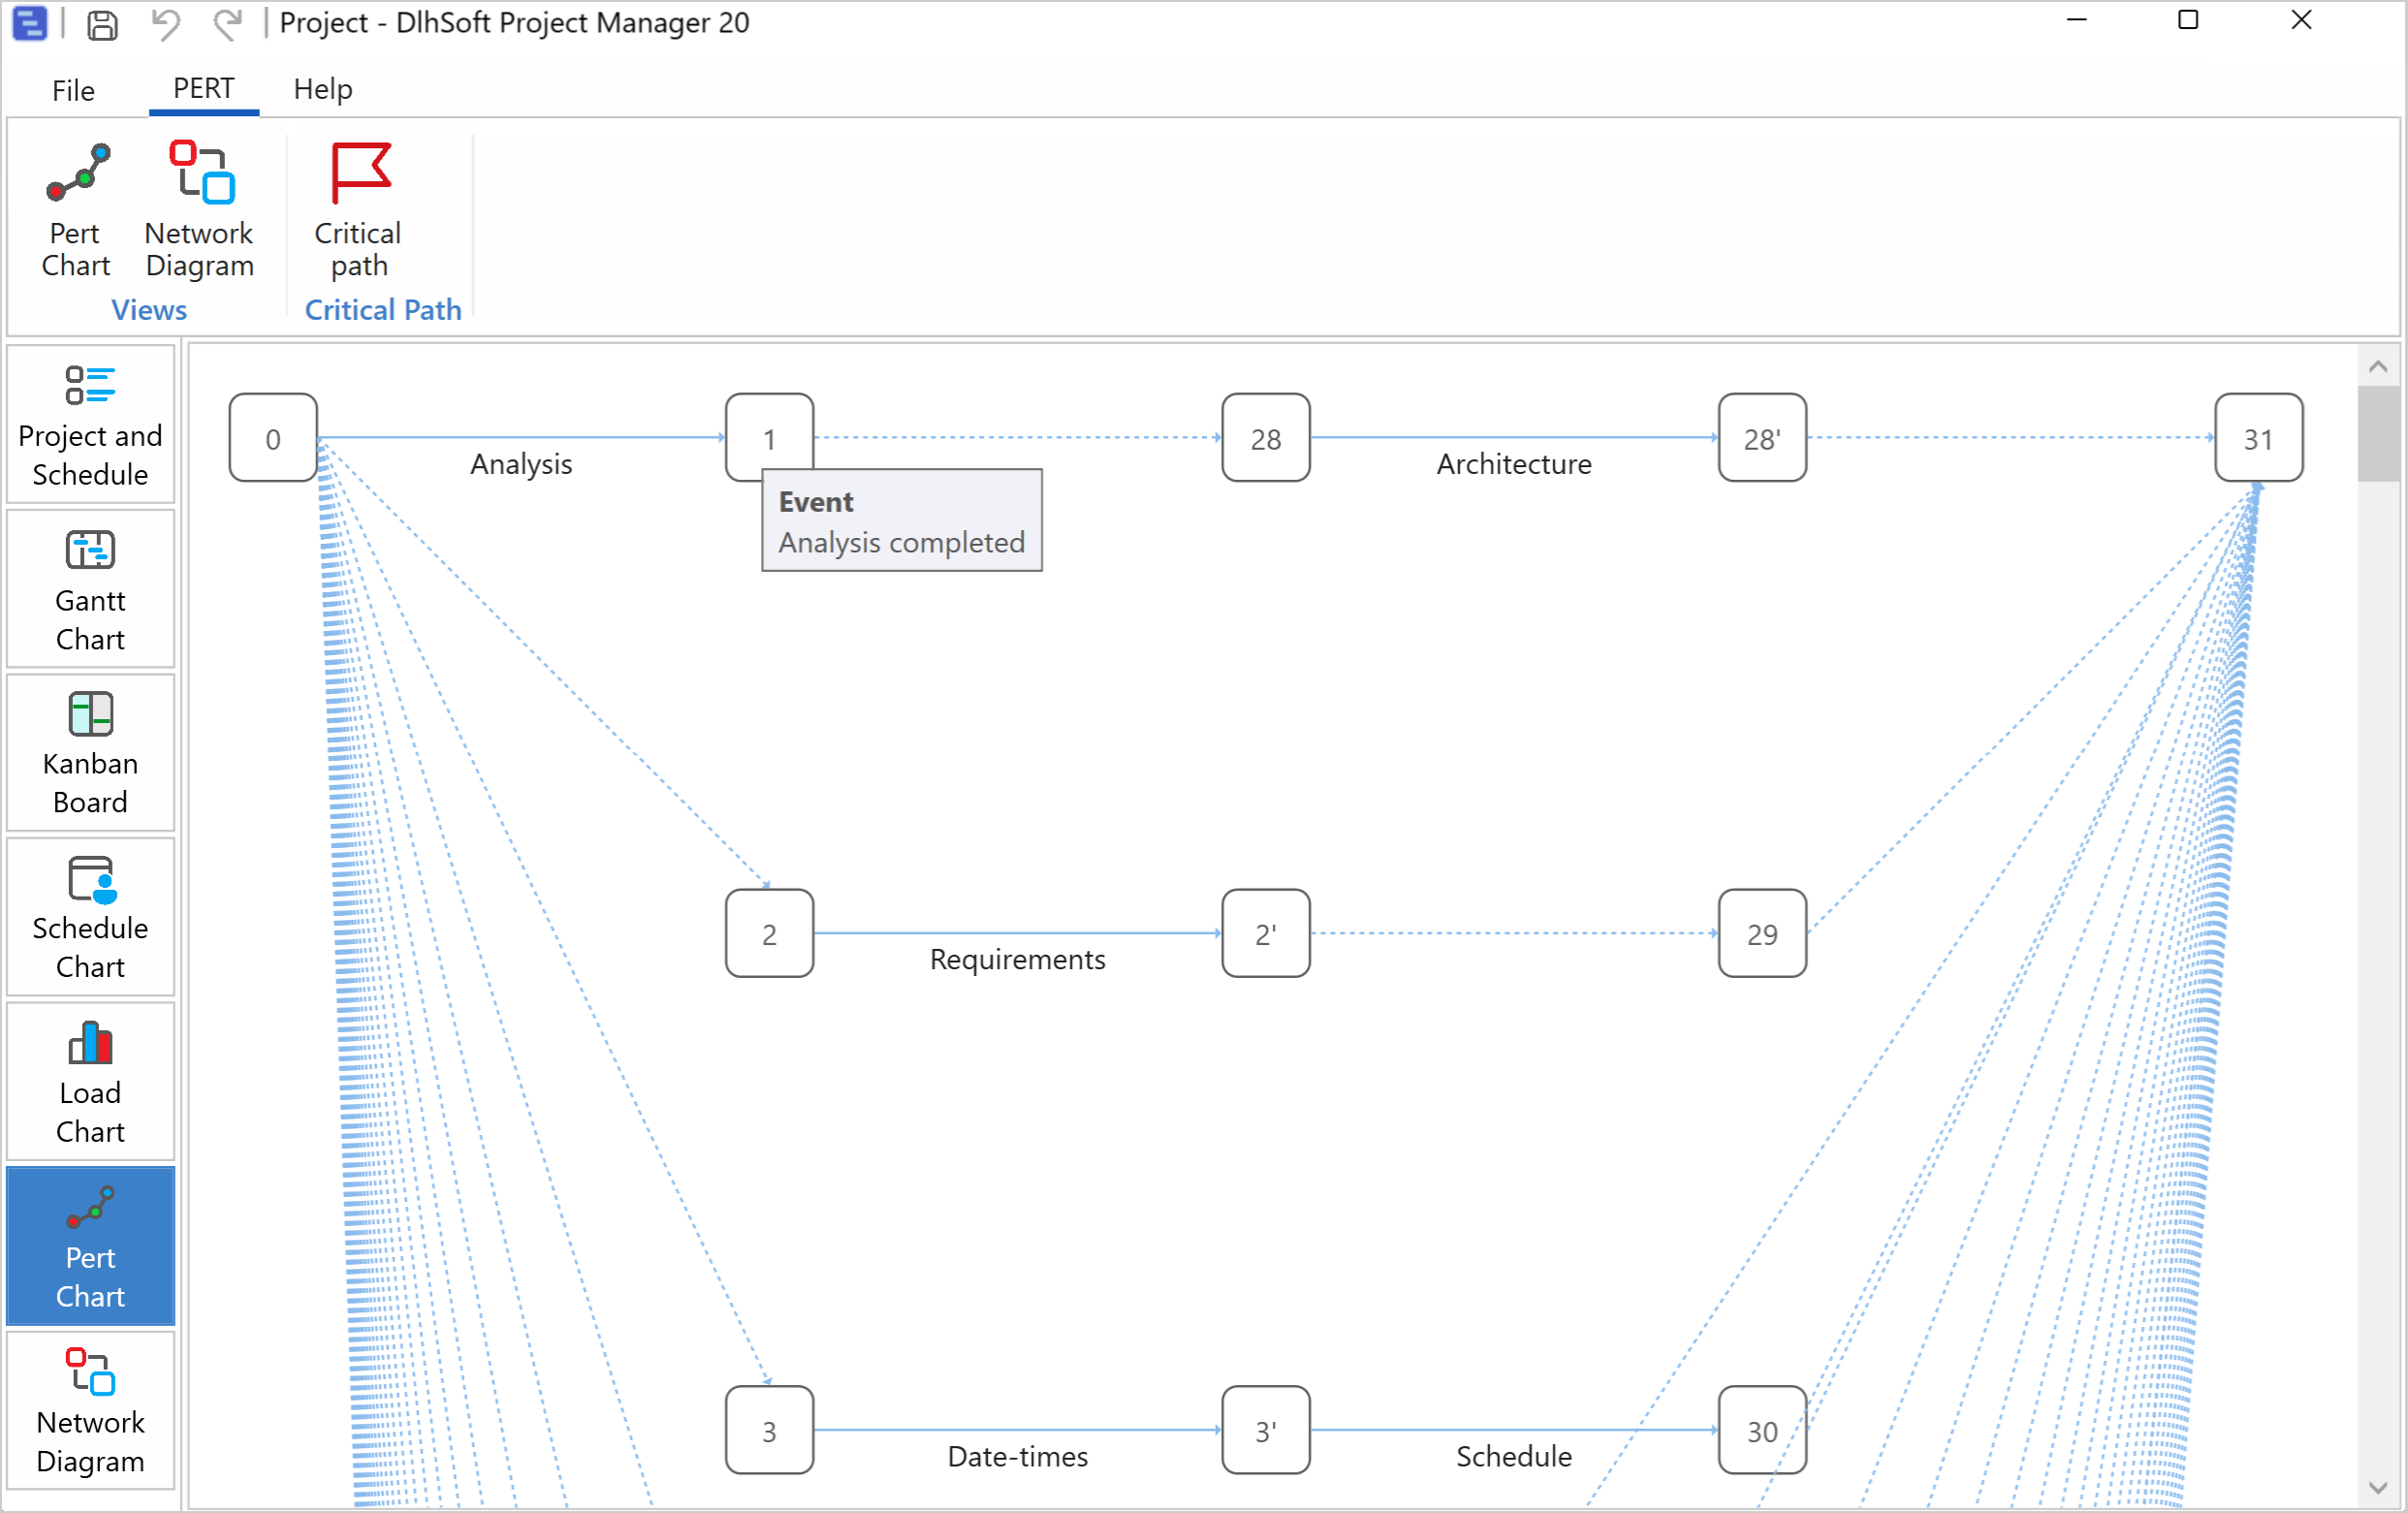
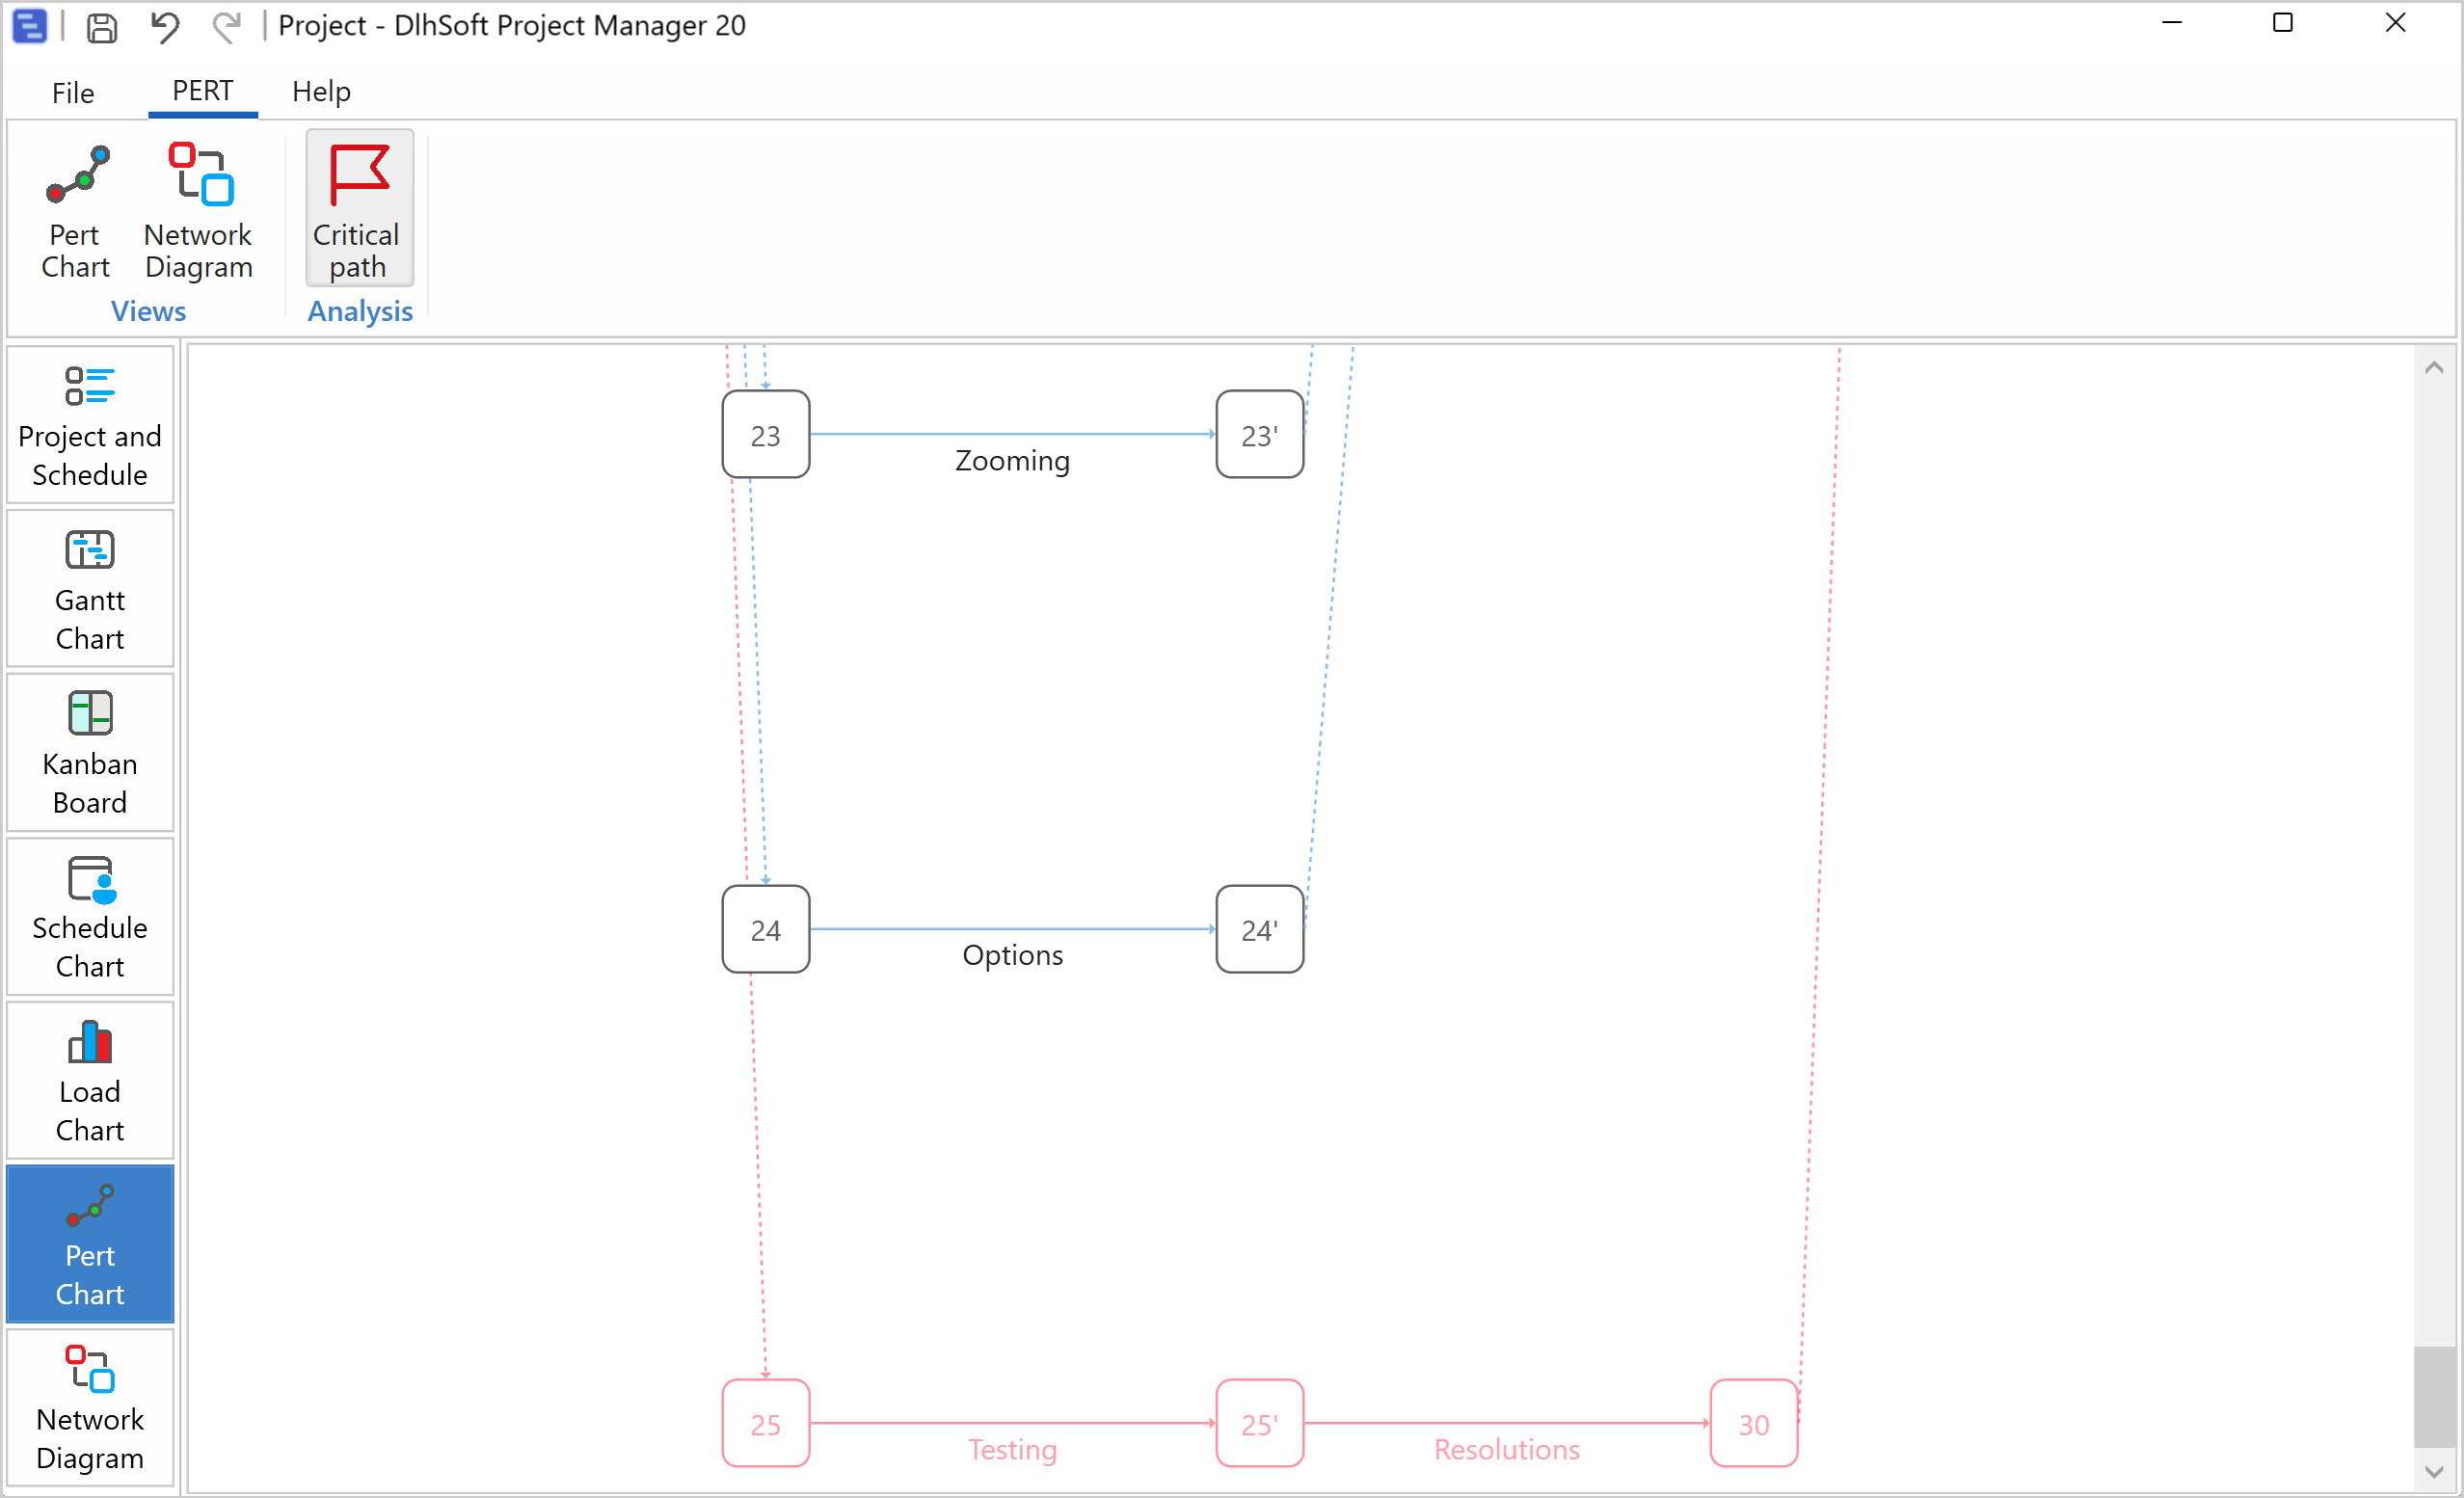
PERT Chart view can be used to better understand how your project's work would flow: you can see virtual events, based on dependencies and milestones in your project and you can print them out, if needed, for further examination.
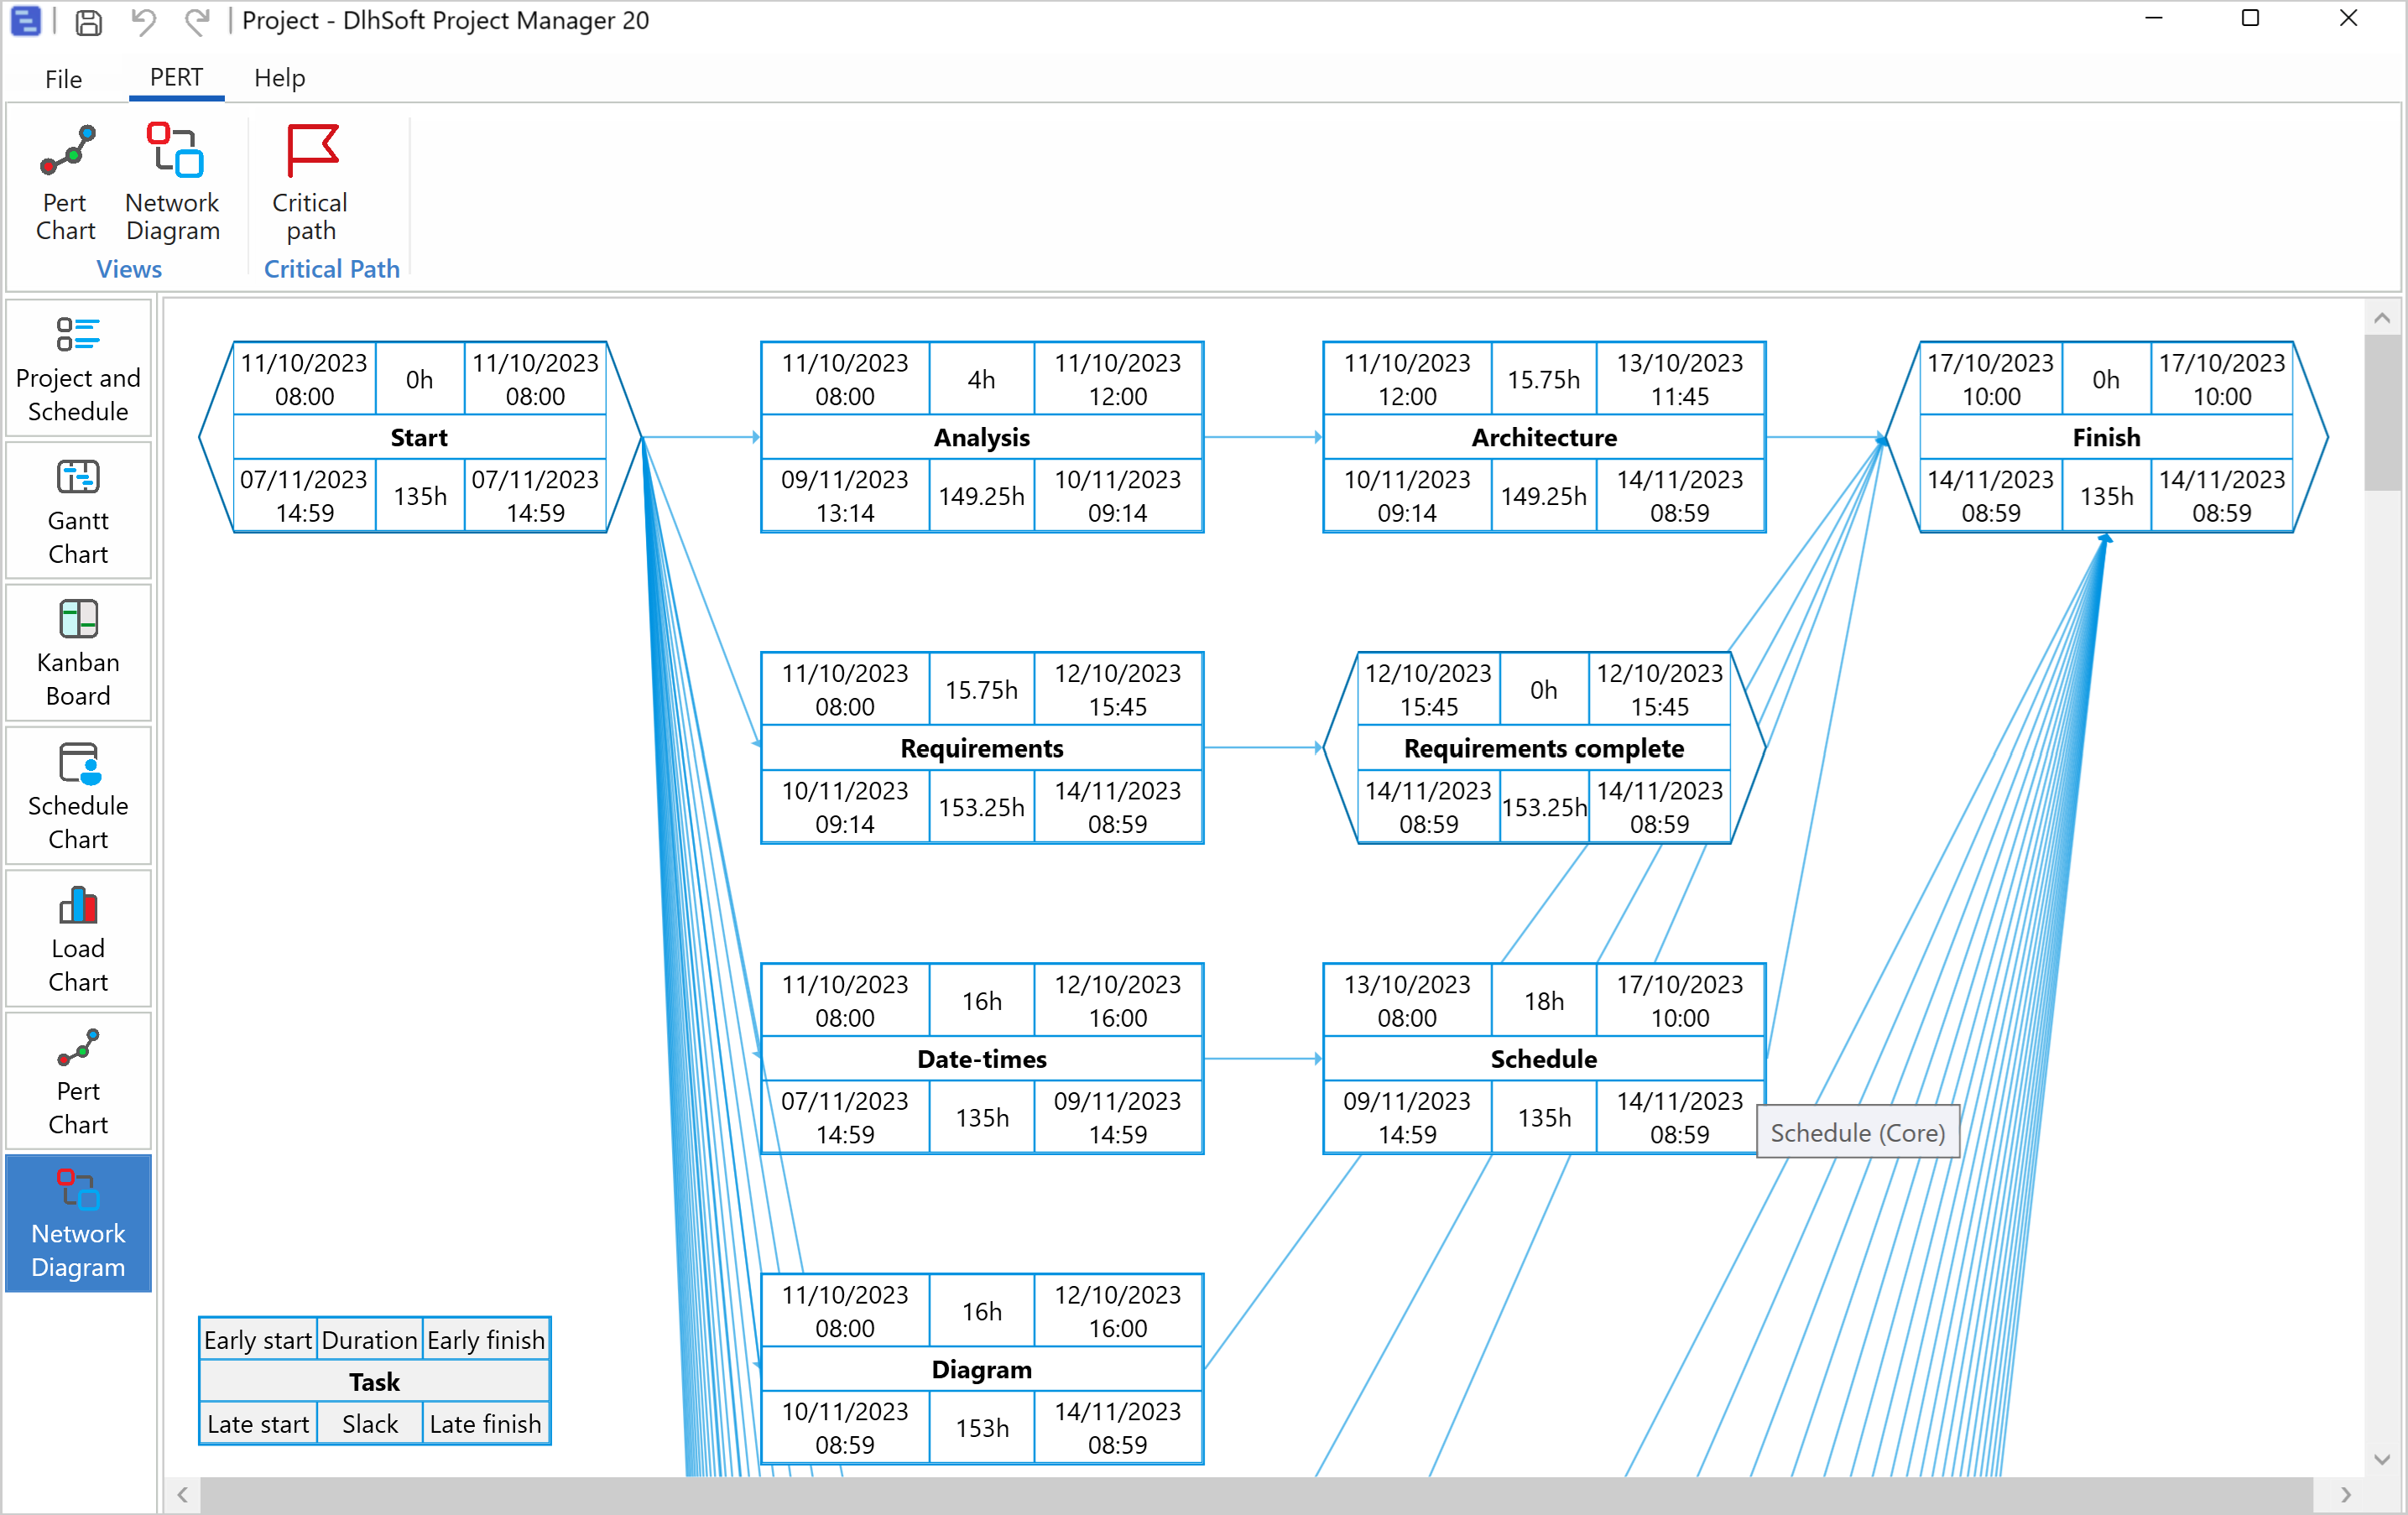
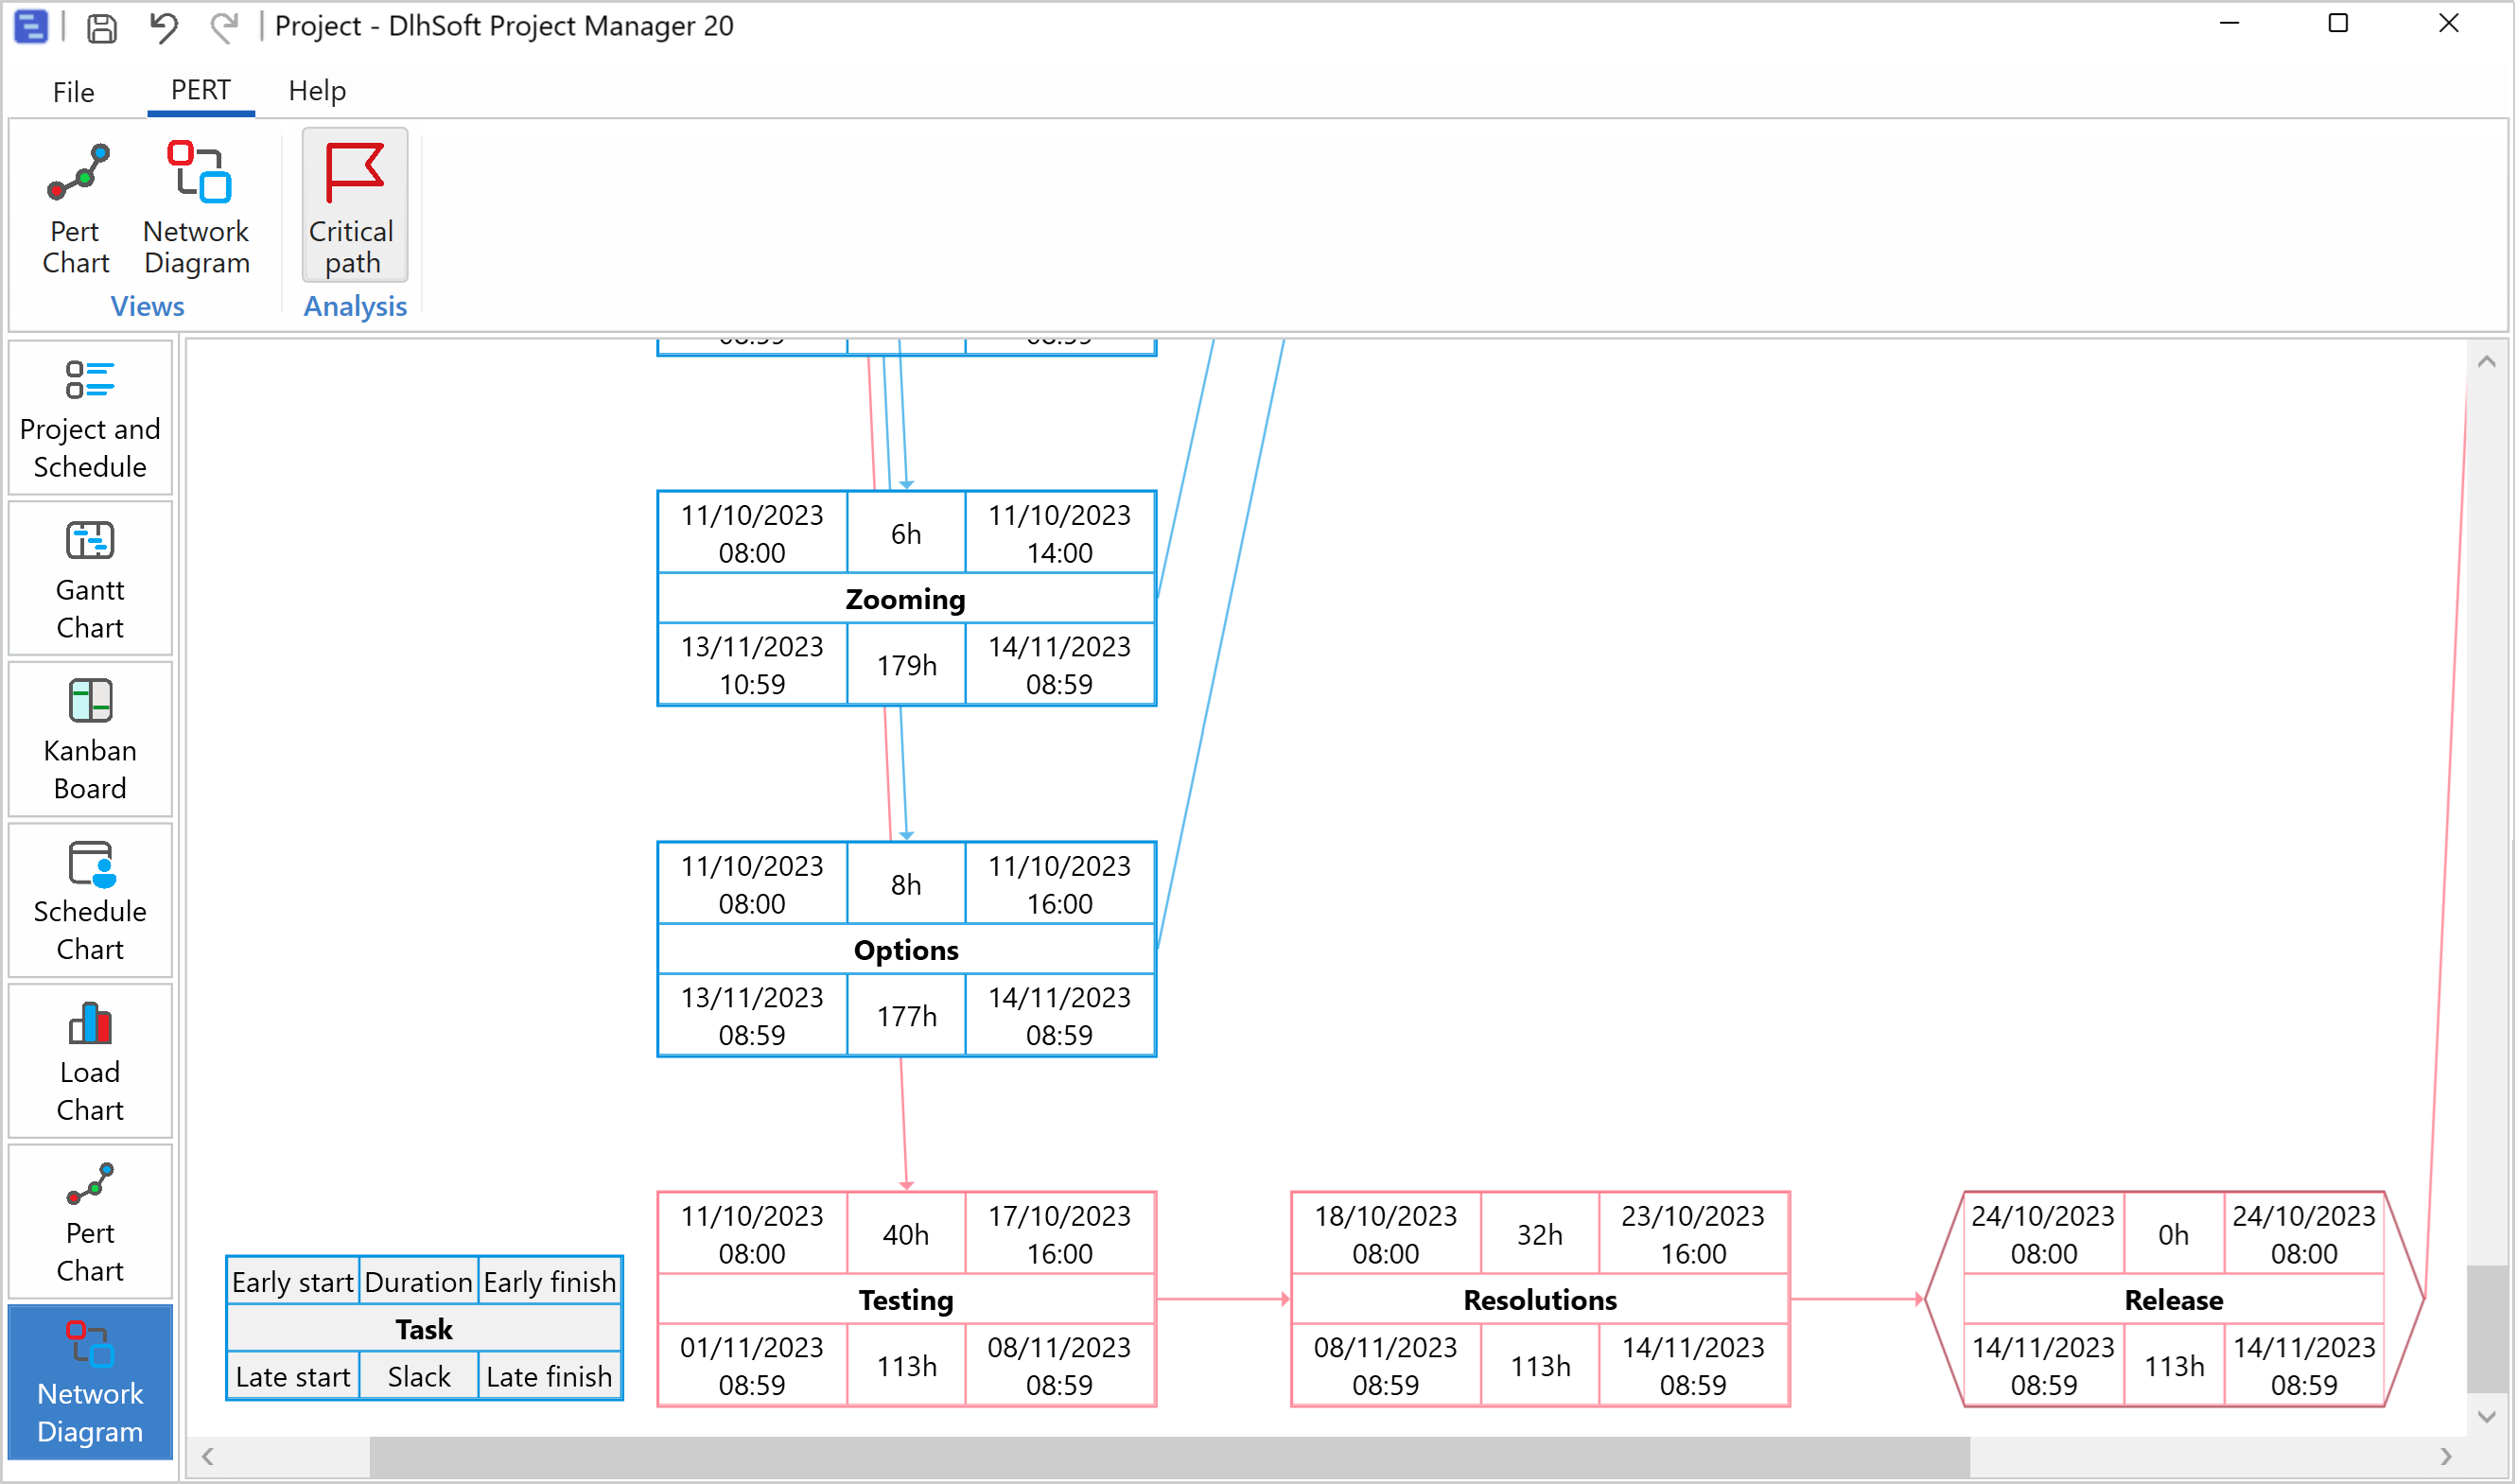
Network Diagram view is also helpful in case you would like to use PERT methodology for viewing the critical path in your project; each task is presented there with computed values such as early and late start and finish, and you can, of course, easily highlight critical items by simply clicking the flag icon in the ribbon.
Once the task hierarchy is established, you can highlight critical items using the flag toggle button in the ribbon, click Gantt Chart left tab, and than Schedule section.
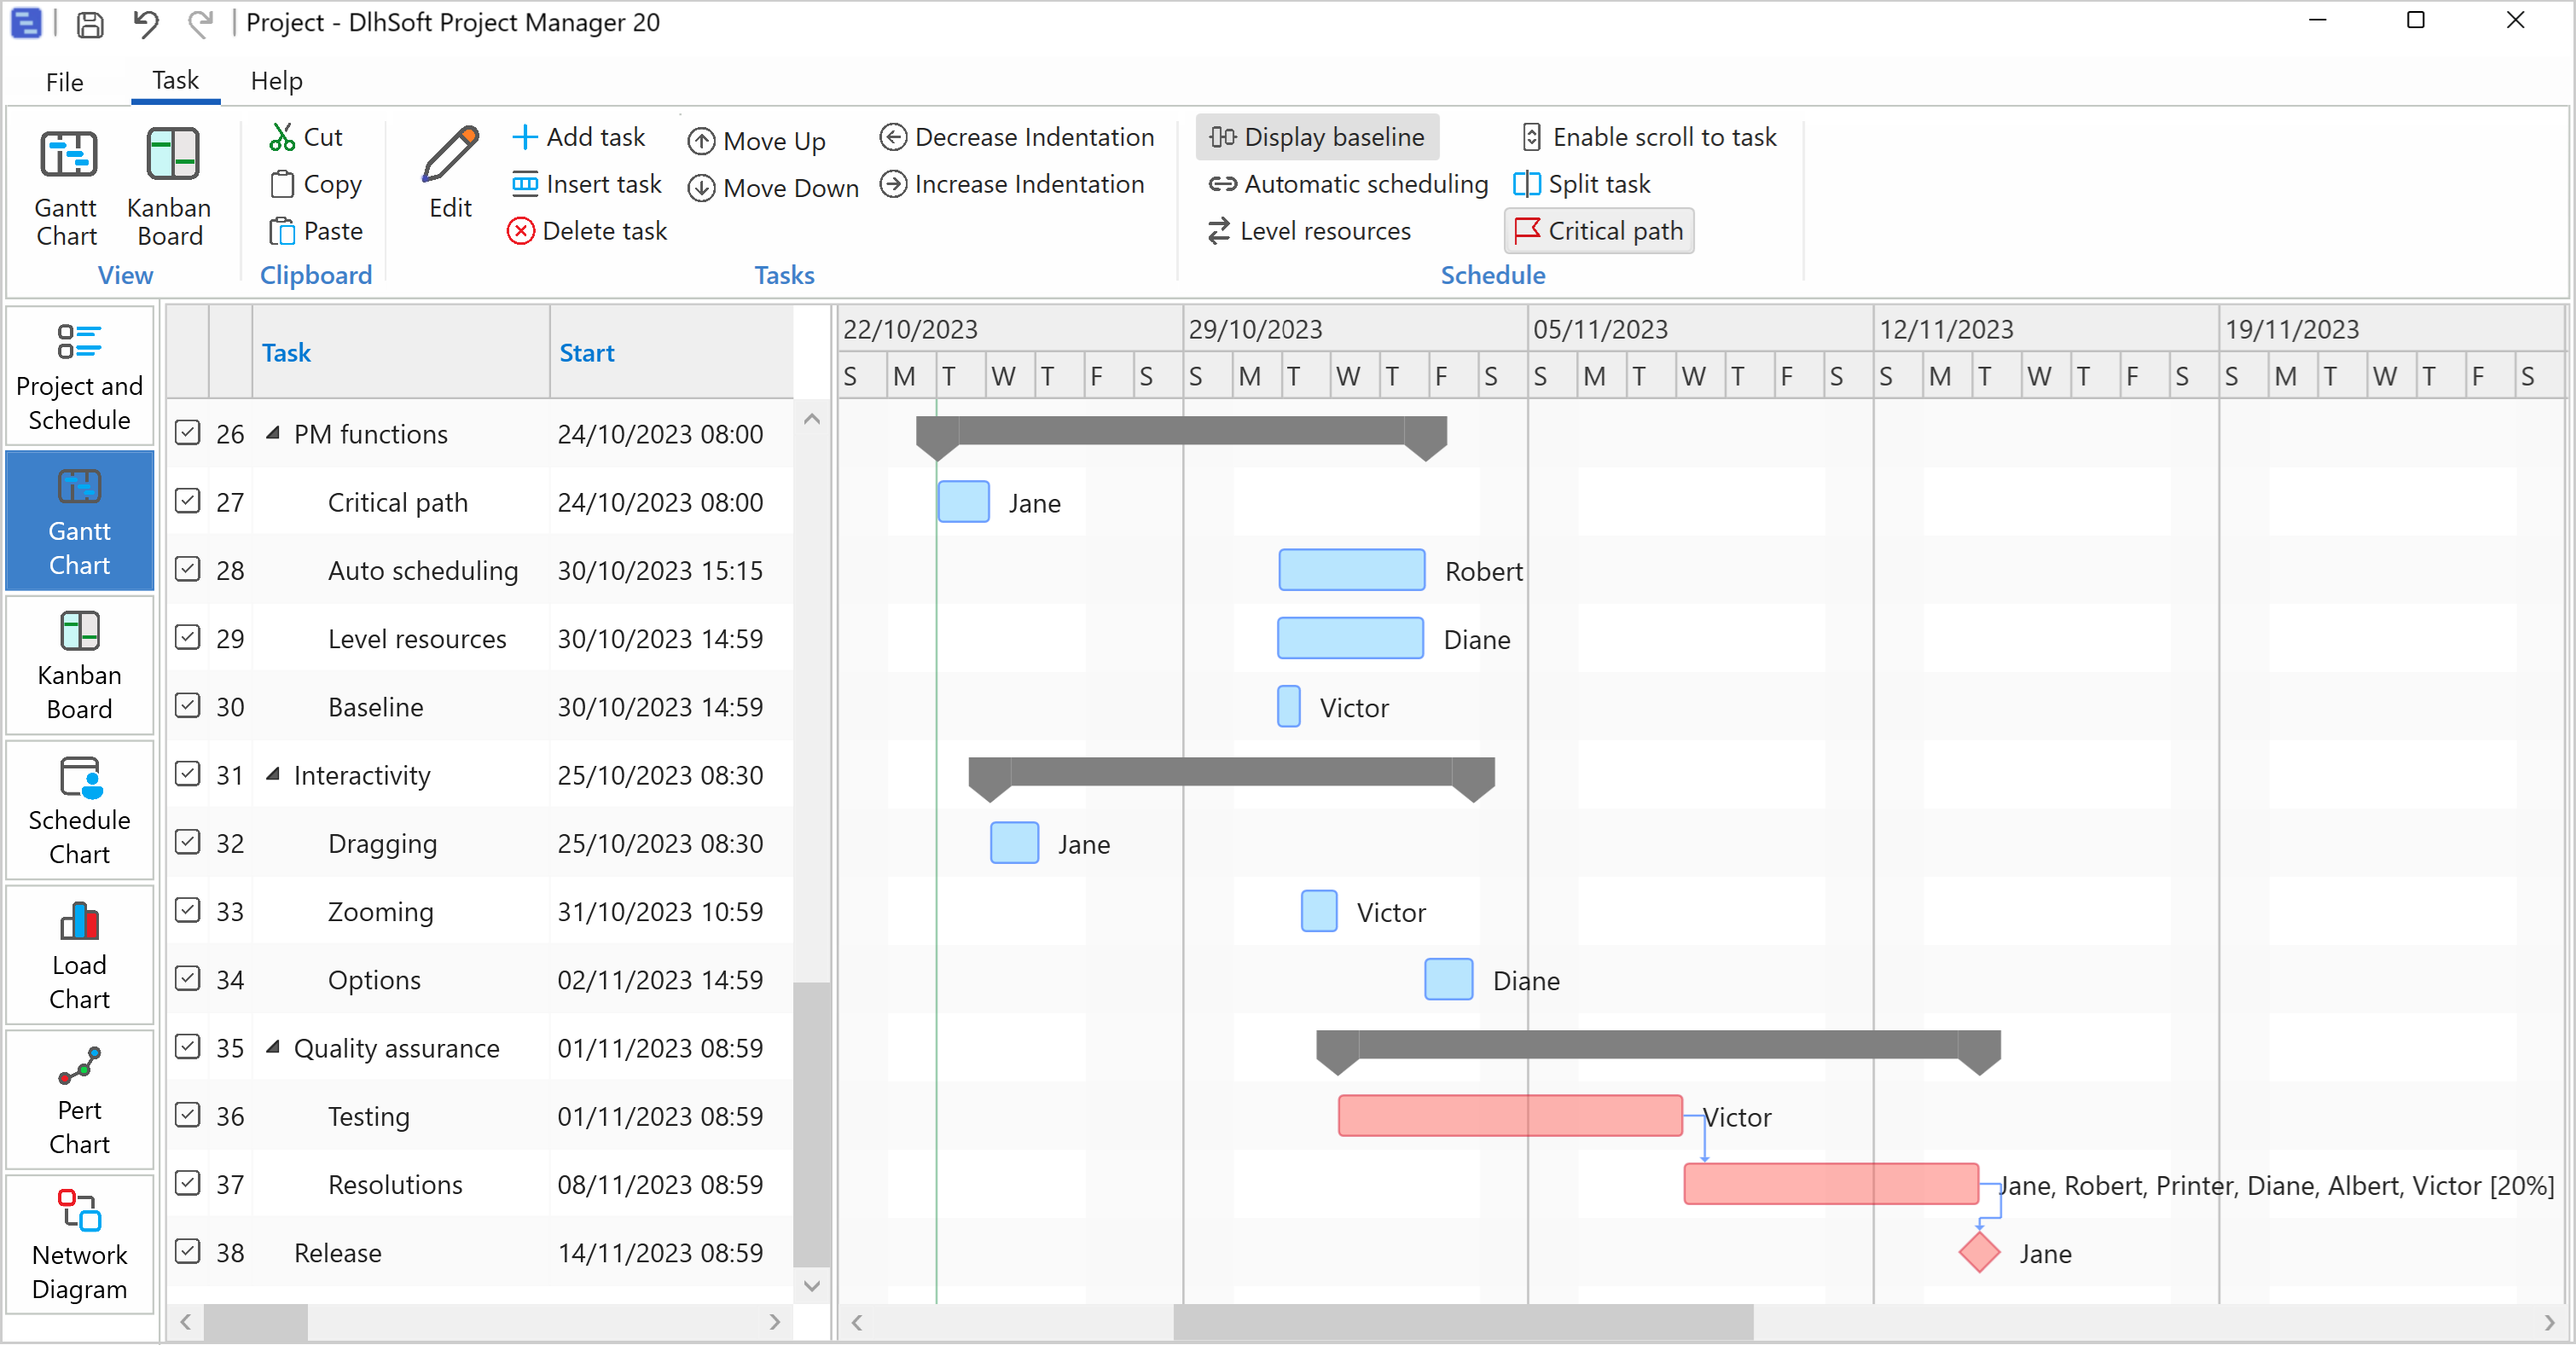
Critical path highlighting is available also for PERT Chart and Network Diagram views, on the Analysis section of the ribbon.
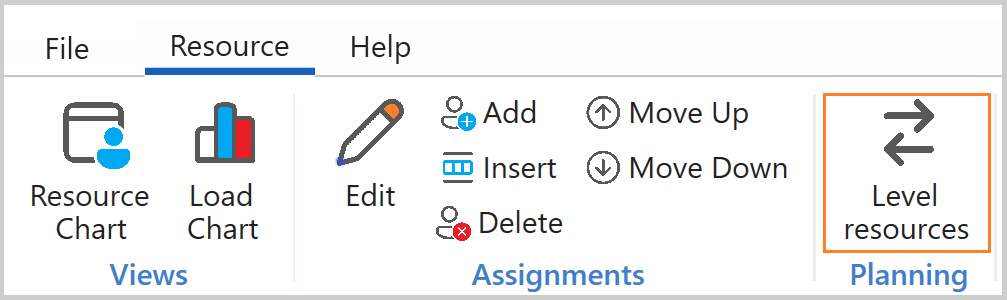
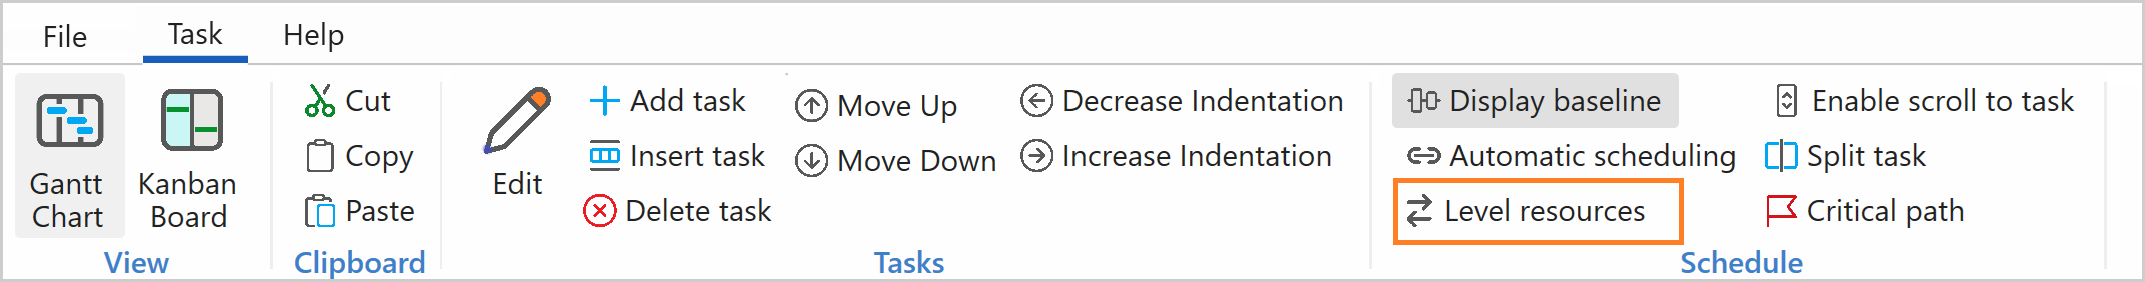
And you can, of course, use auto-scheduling and/or level resources to reschedule tasks and avoid over-allocation (command available in the Task ribbon, or in the Level ribbon in Schedule Chart or Load Chart views).
Also, sometimes it is useful to view baseline estimations for tasks, which can be turned on if you also defined Est. task start and finish values..
Finally, note that you can use Project and Schedule view to see summarized information about the project (left side).
The main calendar (also called schedule) of the project defines working and nonworking time to be considered for all tasks that don't have specific calendars assigned, and it can be configured from the Project and Schedule view (right side).
A calendar is defined by these elements:
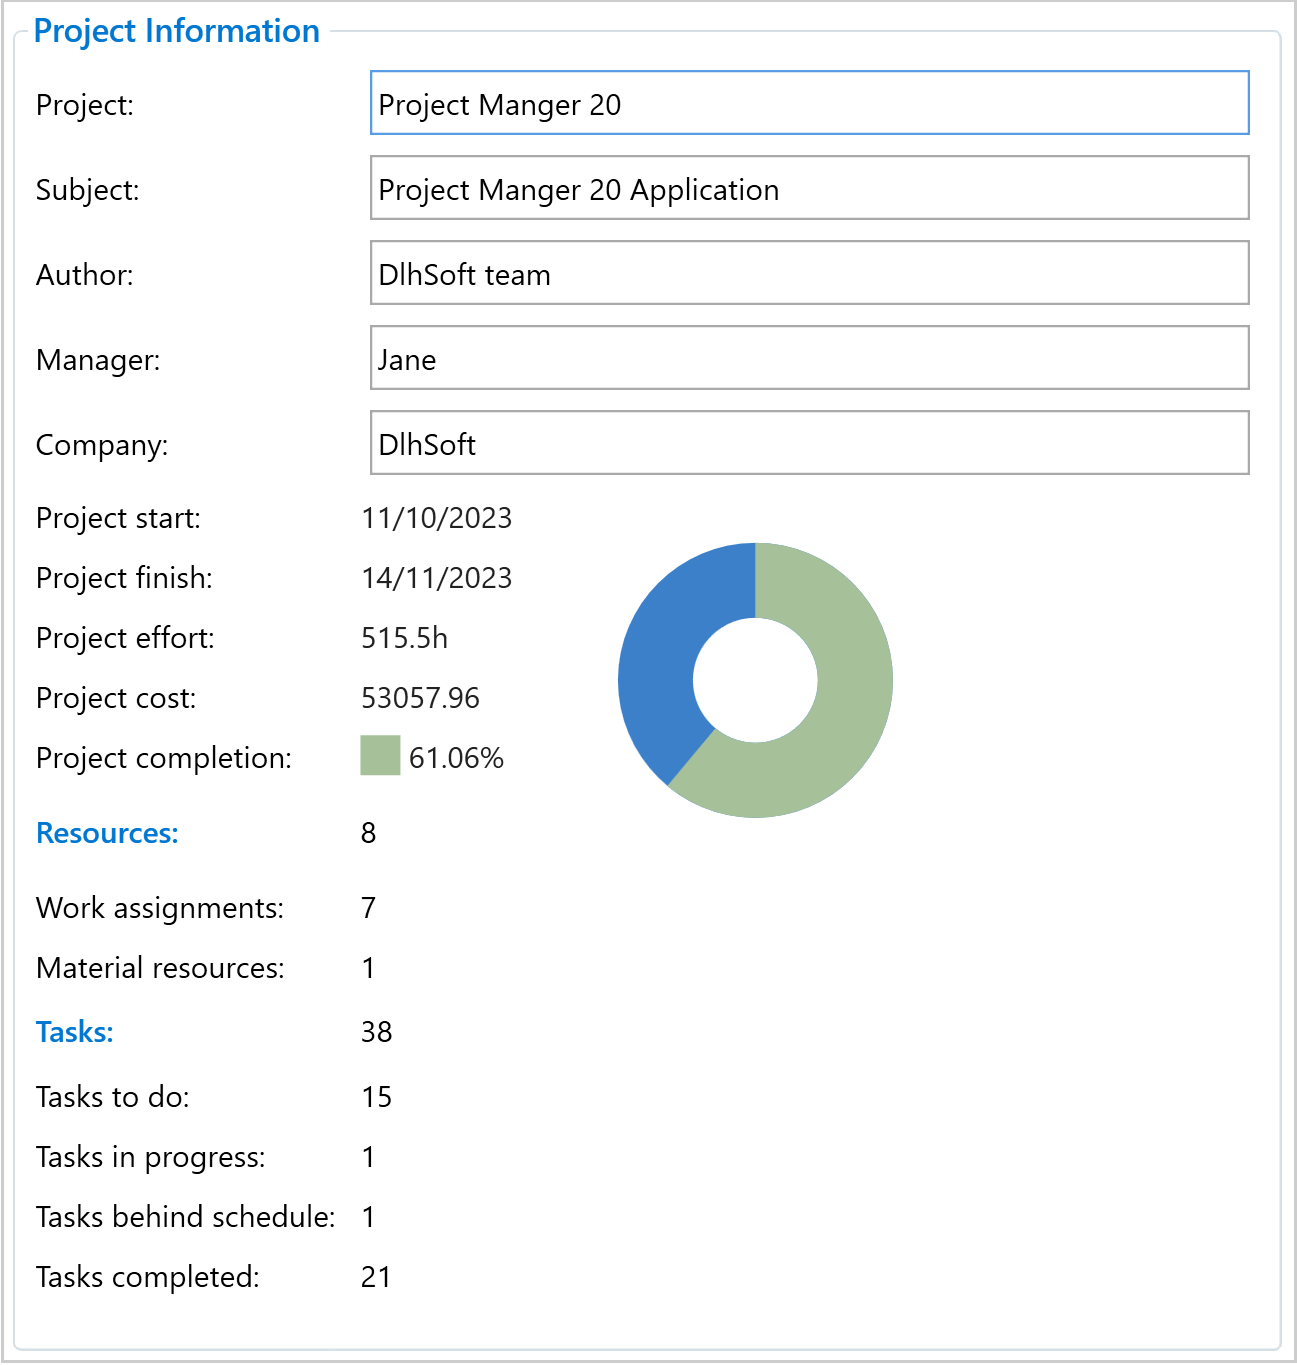
Although summary tasks can present information computed based on their child items directly in the left grid, to view summary information about the entire project you should go to the Project and Schedule view of the application (left side).
The start and finish of the project, its total effort, completion percent, and cost are displayed in the view for reference.
Besides saving projects as XML, you can also print them for further reference using the Print command from the File menu, and export them as PDF.
You can also print for: Kanban Board, Schedule Chart, Load chart, Pert Chart or Network diagram view.