for Projectis 2.4 – DlhSoft, 2023
Projectis allows you to create and edit projects defined as lists of work items (also known as tasks) and their inner-dependencies and resource assignments and allocations. Projects can be saved as .project files, and can be exported as (and imported from) Microsoft Project XML content. Each open project will have an individual document window managed by Projectis app.
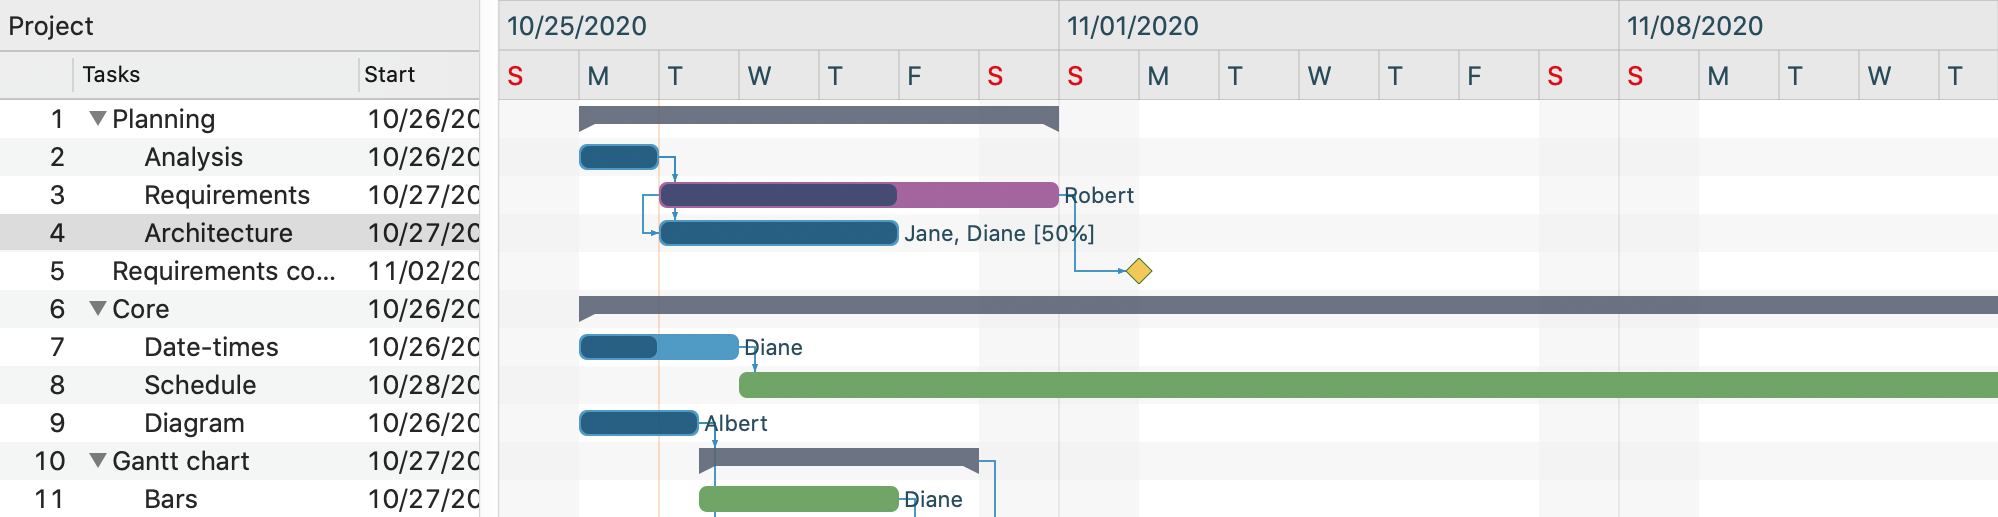
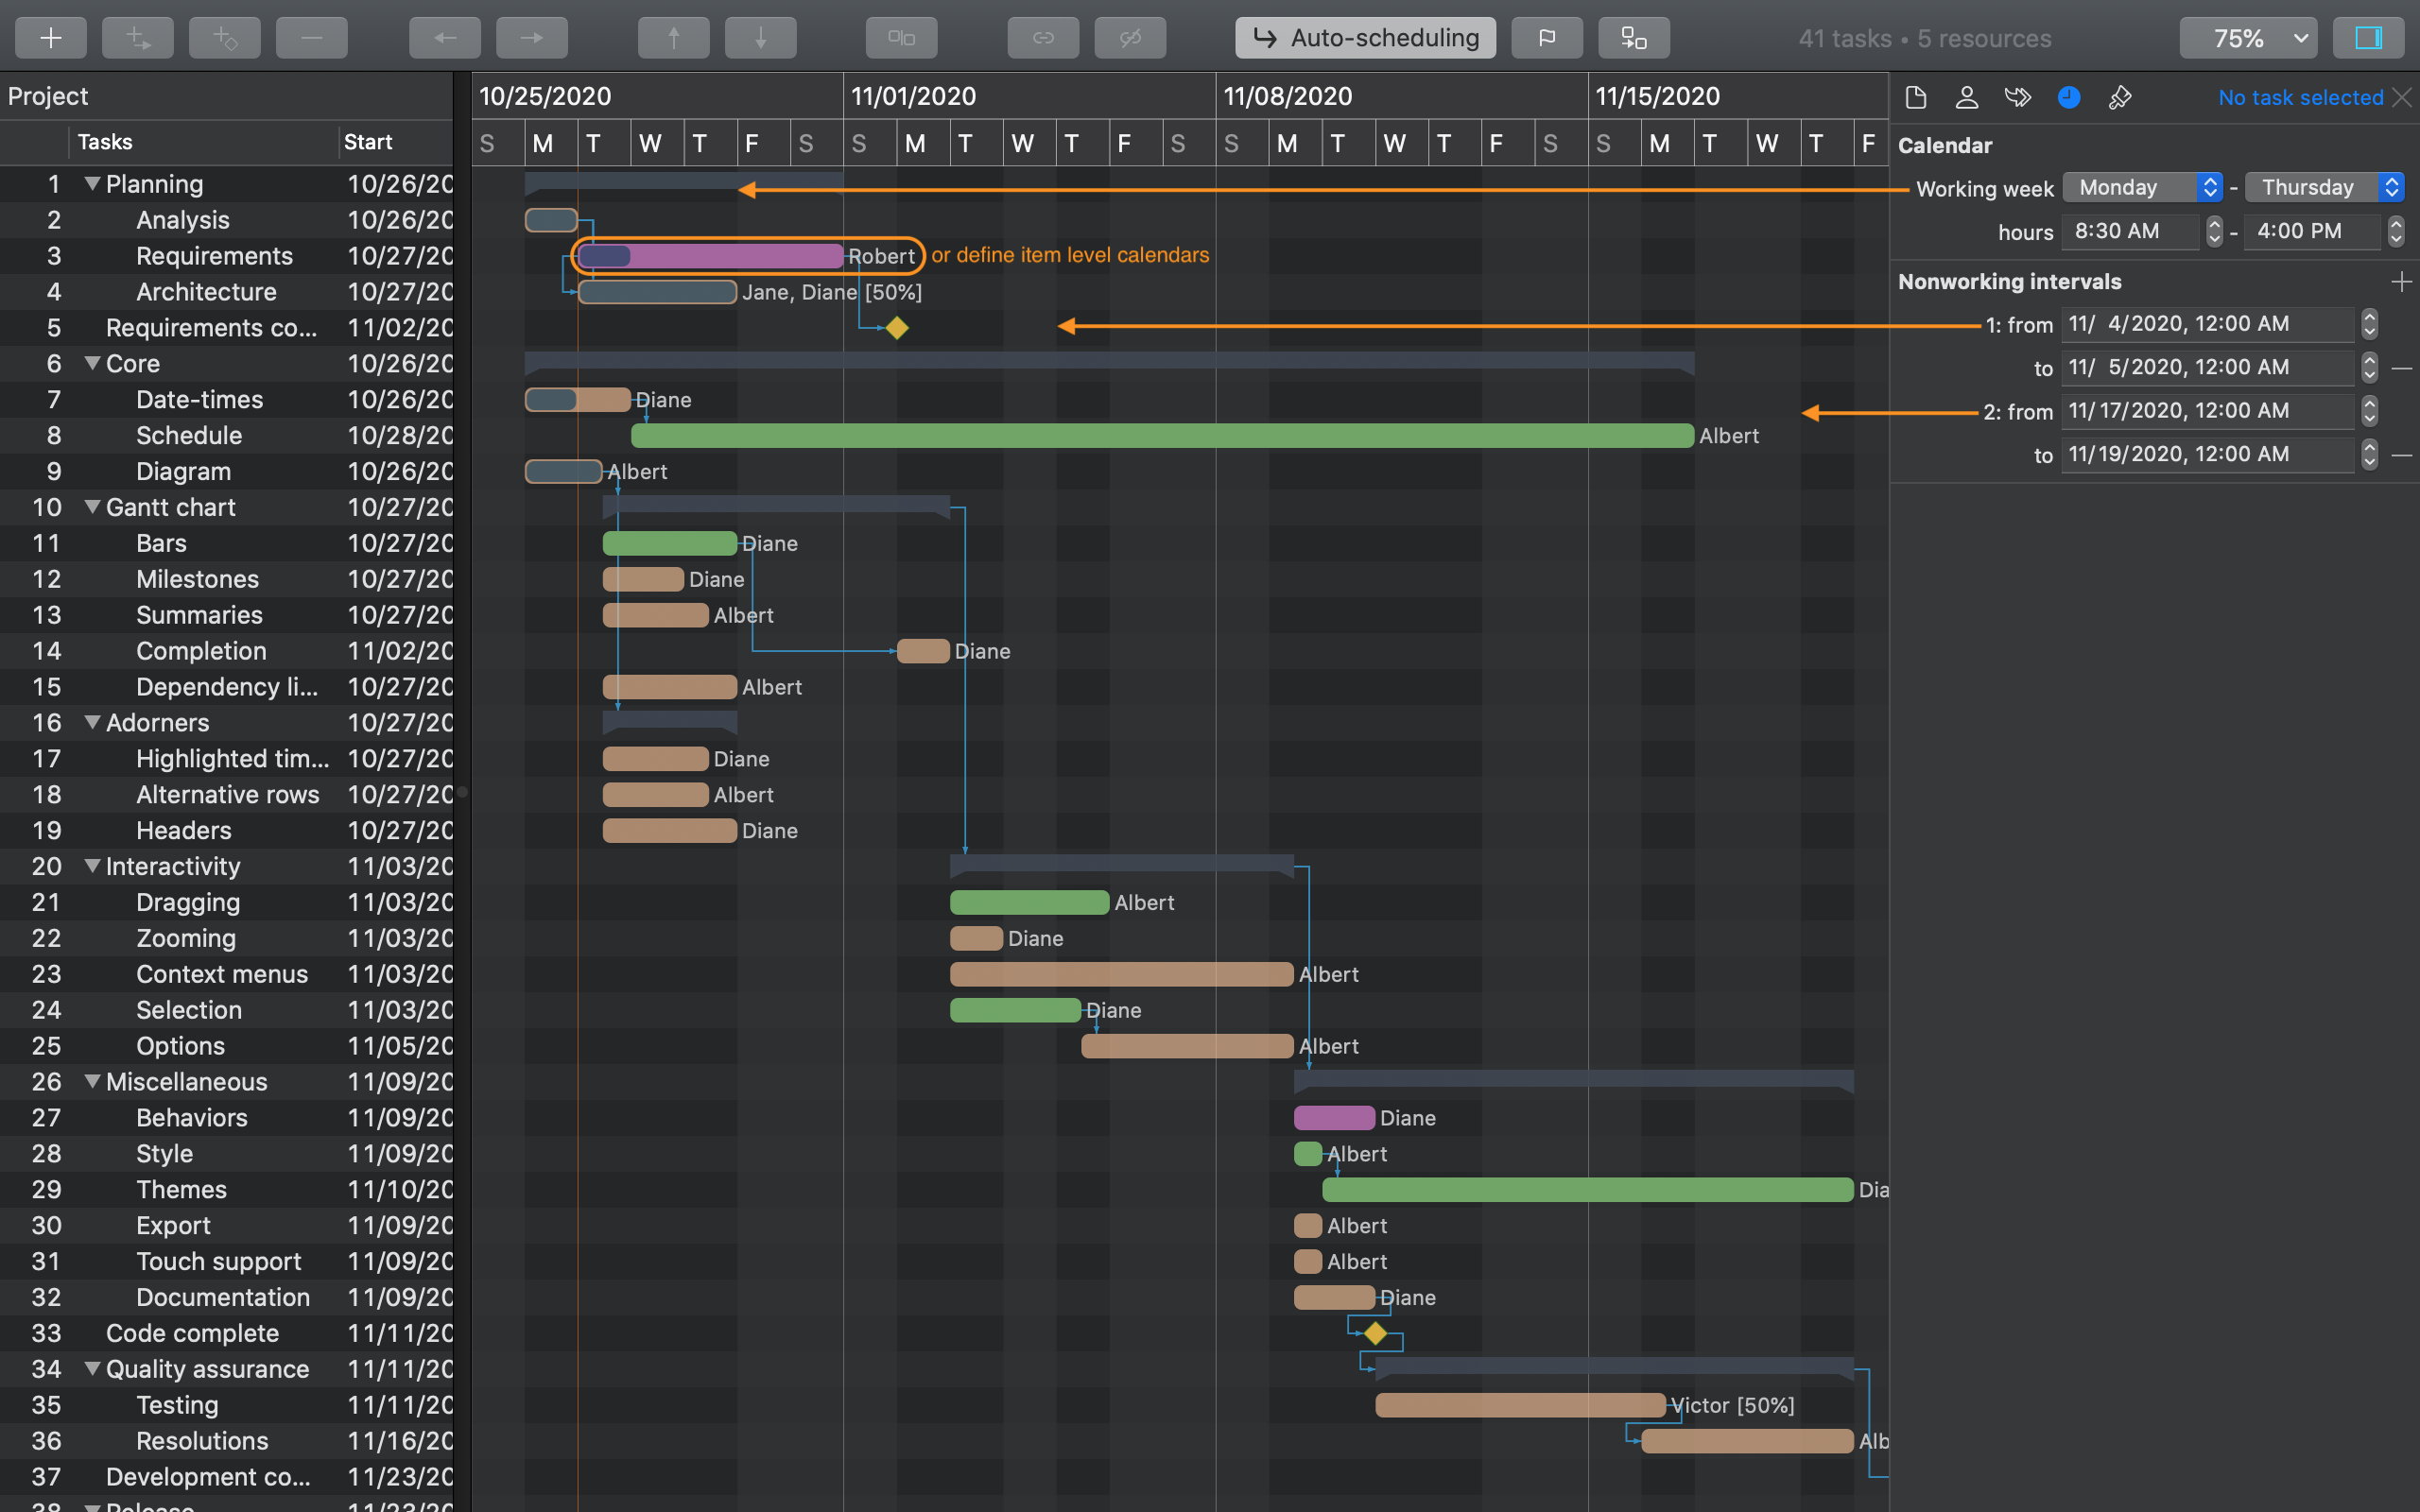
When a project file is open, tasks are displayed in an outline view (left side) as well as bars within a synchronized Gantt chart presented in the main area of the screen. You can update task values either in the grid directly, or by performing drag operations in the chart:
To add and remove tasks you can use Add (plus) and Remove (minus) buttons from the toolbar.
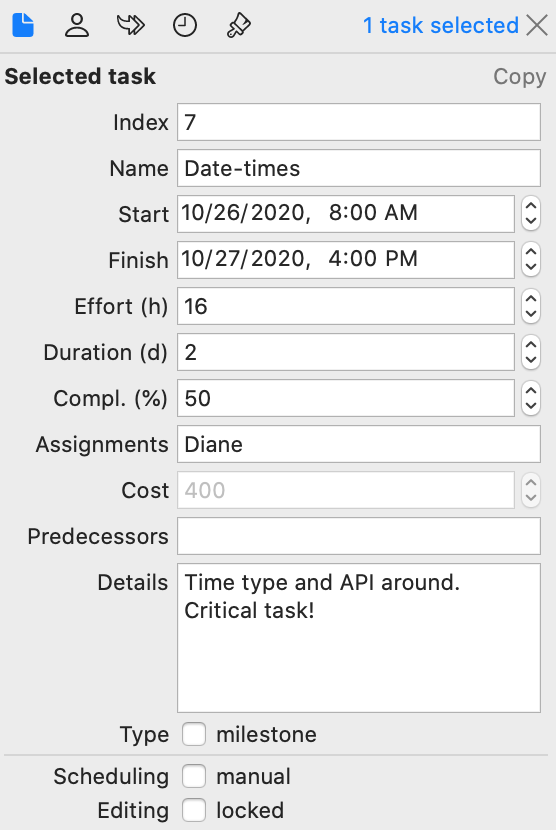
Moreover, you can view and edit the currently selected task from the Diagram inspector, the first within the inspectors side bar (available in the right side of the screen, when Show Inspectors command from View menu is checked.)
Tasks are defined by these main fields:
A project stores tasks using a hierarchy, exposed in the left grid by corresponding expand and collapse buttons.
Summary tasks can be configured by increasing and decreasing the indentation level of individual items using the left and right arrow buttons from the toolbar, and are used to group and automatically compute information (such as start and finish values) based on their child items alone.
You can also move tasks up and down within their container, using the vertical arrow buttons from the toolbar.
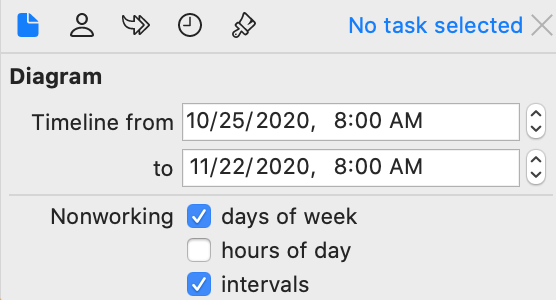
Note: the Gantt chart area will be scrollable between the start and finish dates of the timeline, which you can configure from the Diagram section of Diagram inspector, too. (Diagram section appears at the top of the inspector view when no task is selected in the left grid.)
From the same section in the inspector view, you can specify whether you want nonworking days of week, hours, and any custom intervals displayed (although having a grayed out background color) in the chart.
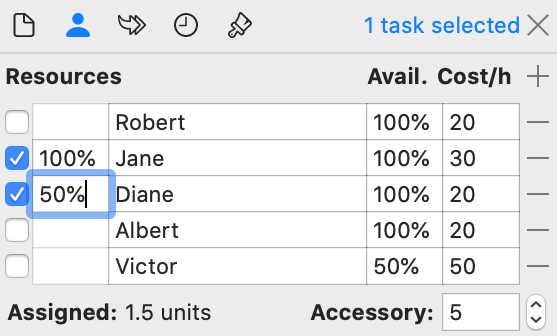
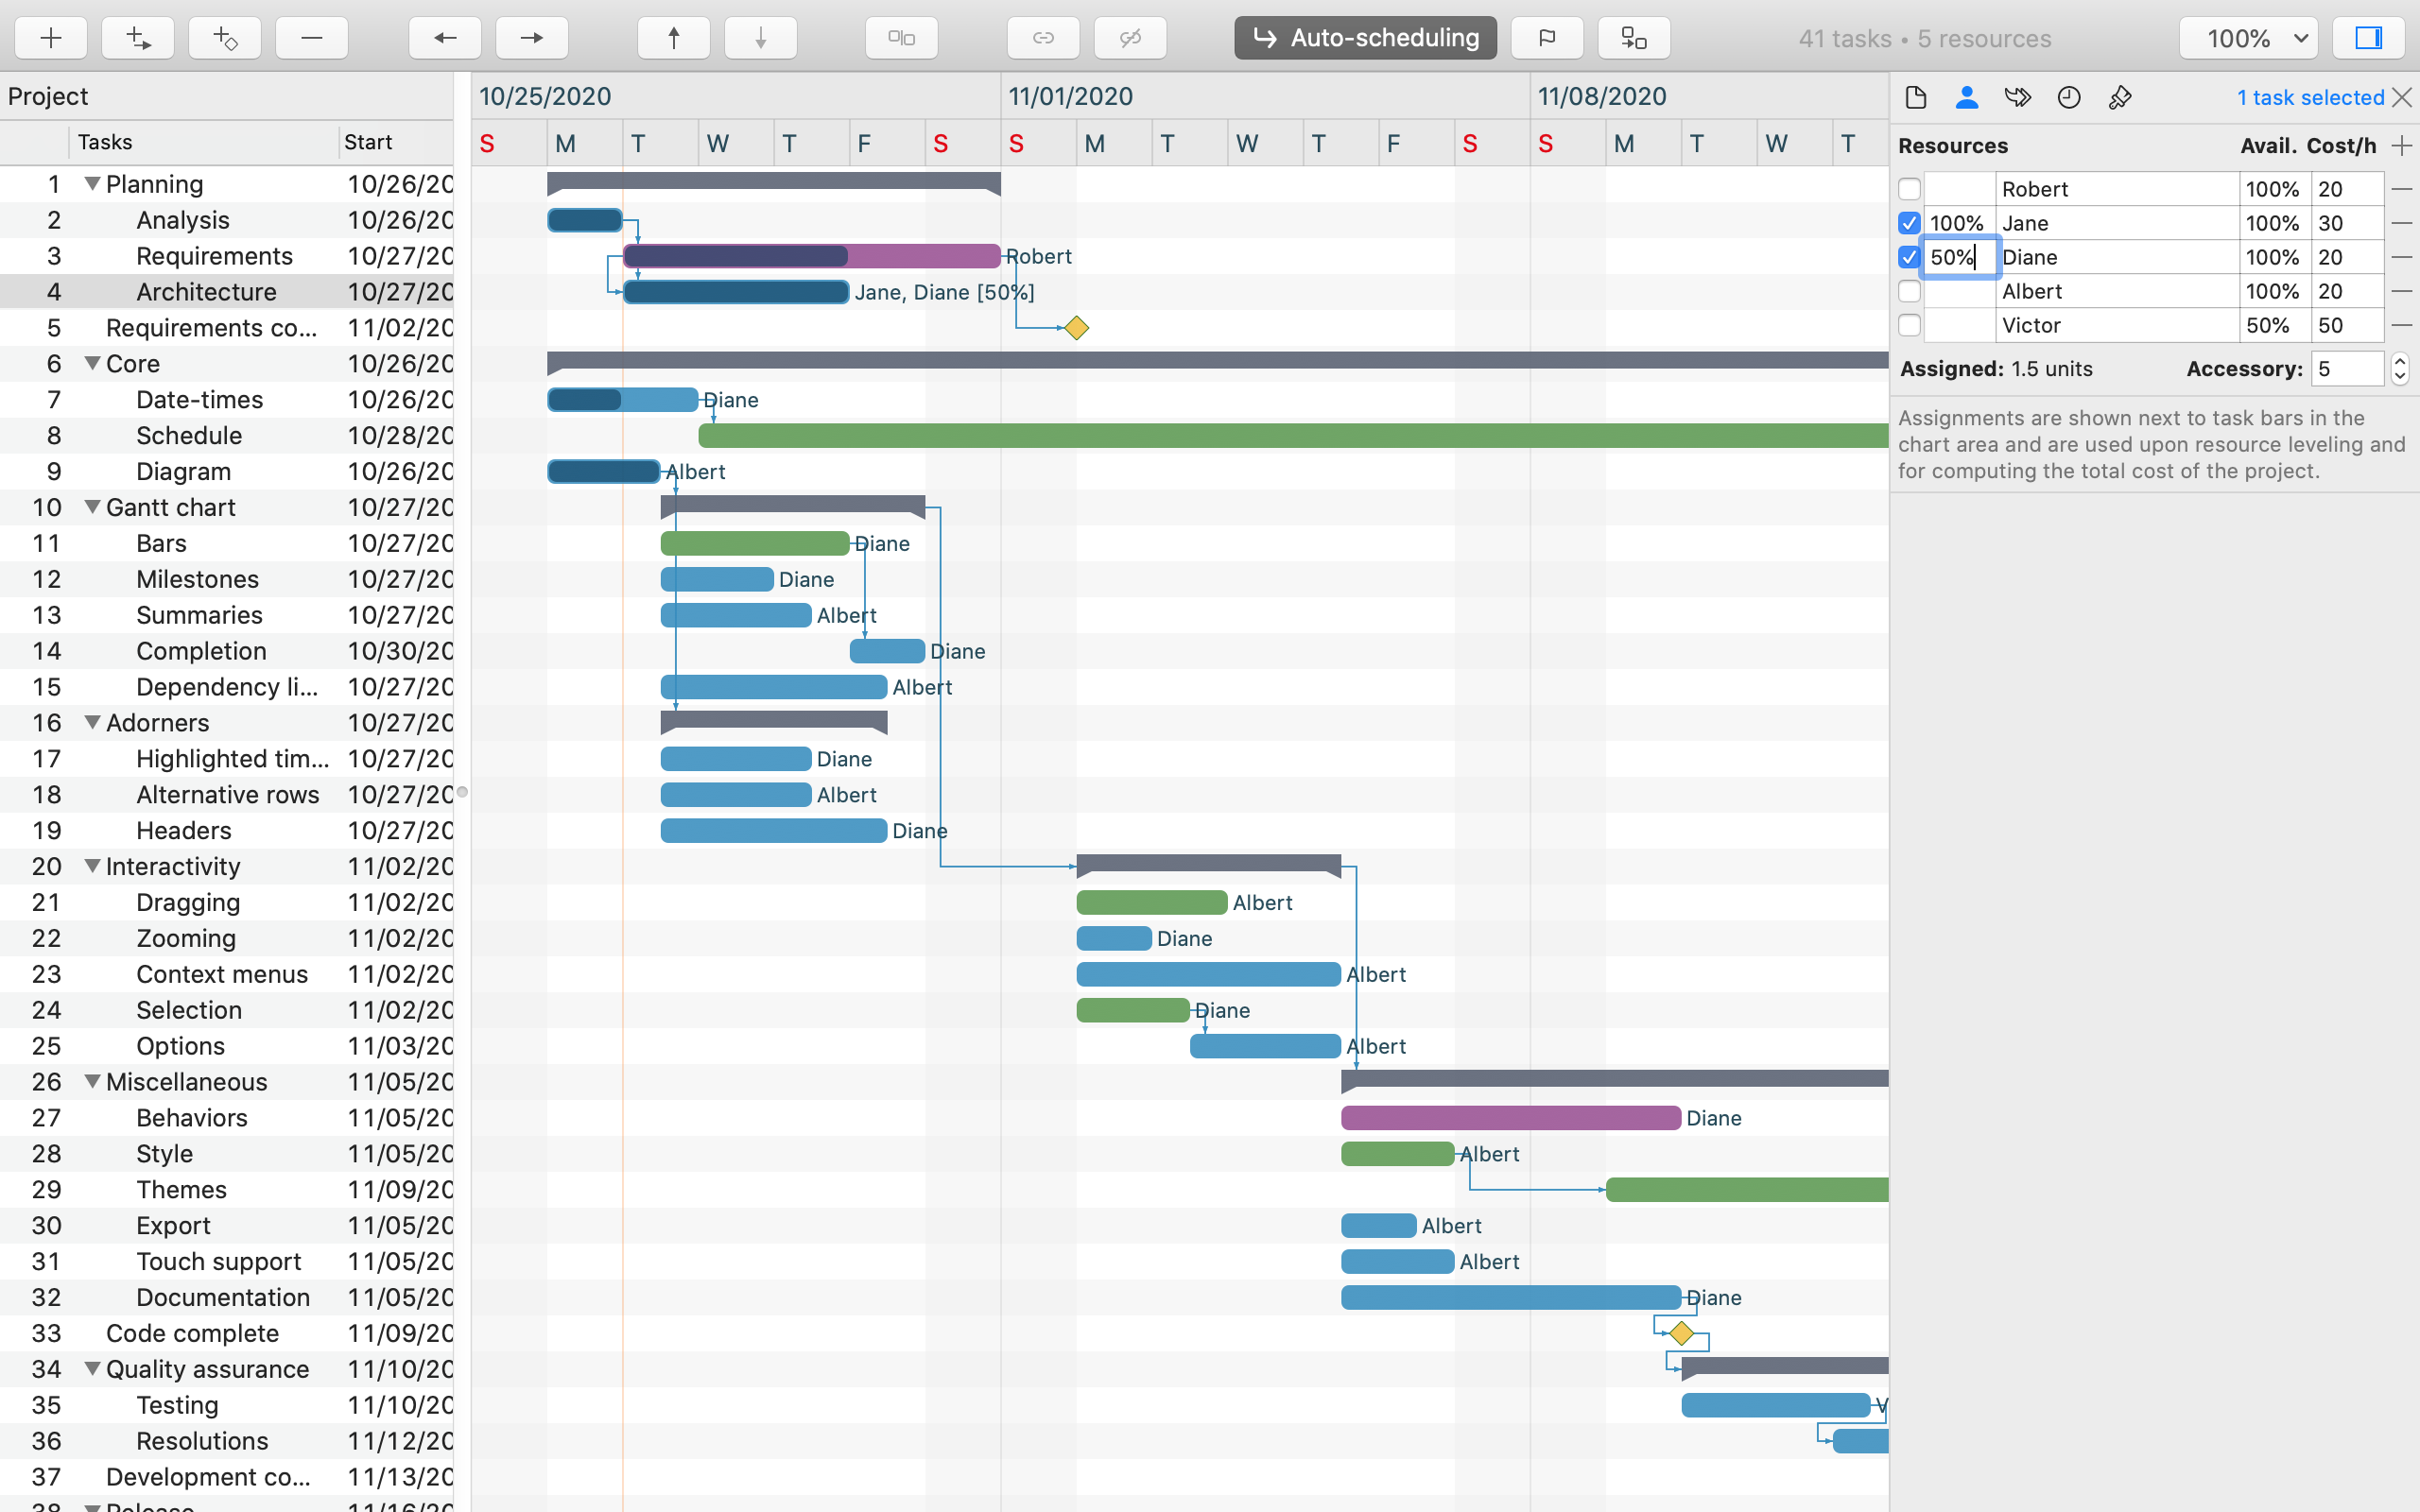
You can create and remove resources from the Resources inspector using plus and minus buttons there. If a task is selected in the left grid, you'll also be able to define its assignments, optionally selecting the allocation units to apply.
The effort value of a standard task is computed considering all its resource assignments. For example, if both Jane and Diane are assigned to the task while Diane is allocated with a 50 percent limit and the task spans for 2 working days (16 hours), its computed effort will be: 24 hours (multiplying 16 hours by 1.5 allocation units.)
Adding, updating, and removing resource assignments will preserve the effort value of the associated task, and will trigger duration changes instead, according to the new total allocation units assigned.
By default, resources will be set to have 100% availability, but you can change it if needed. Also, resource costs can be individually defined, and/or a general accessory hourly rate can be set to apply to all tasks, regardless of their assignments.
Note: addding or removing assigments will not automatically update the duration of the selected task.
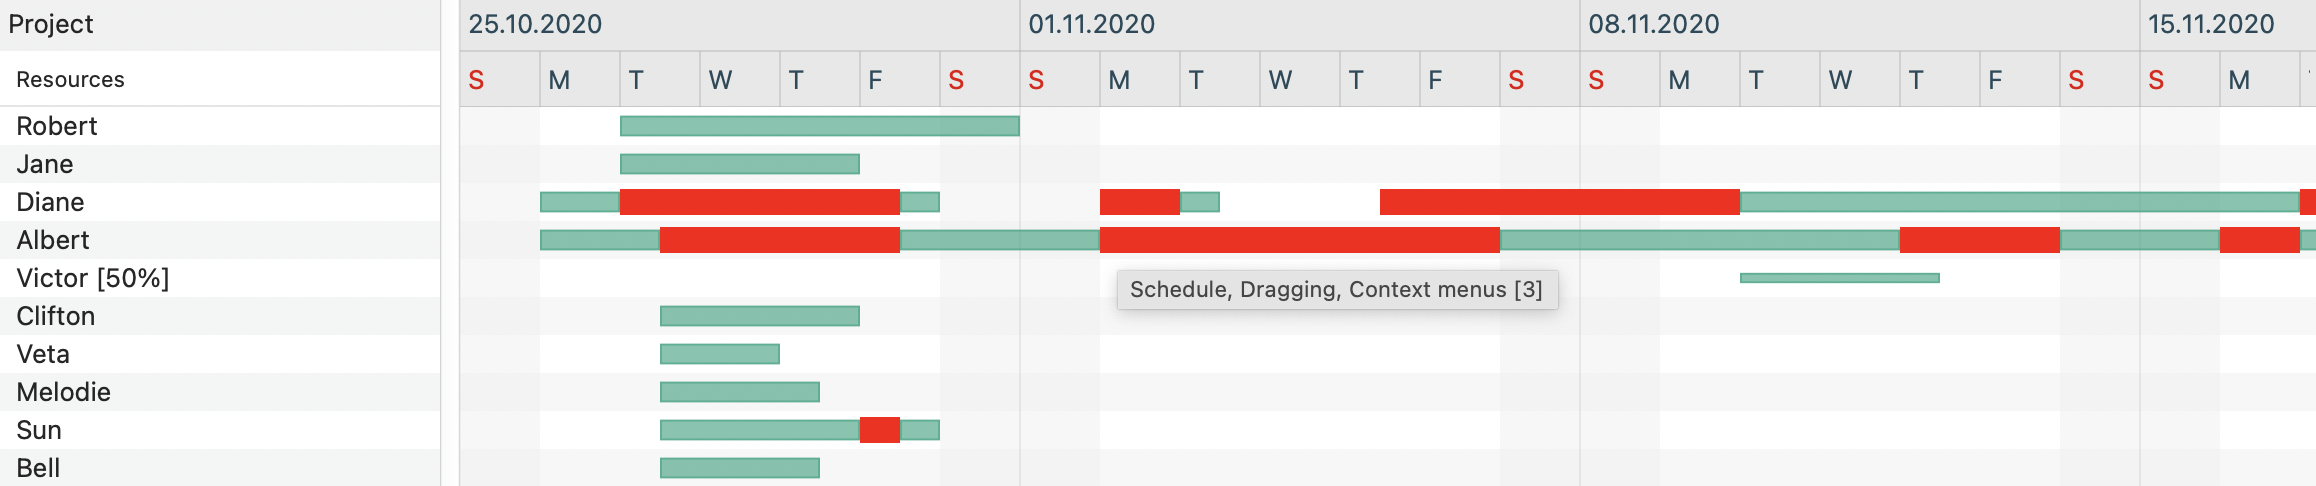
To easily identify resource allocation bottlenecks you can use the Load chart view that you may access from the View menu ot from the drop down in the toolbar.
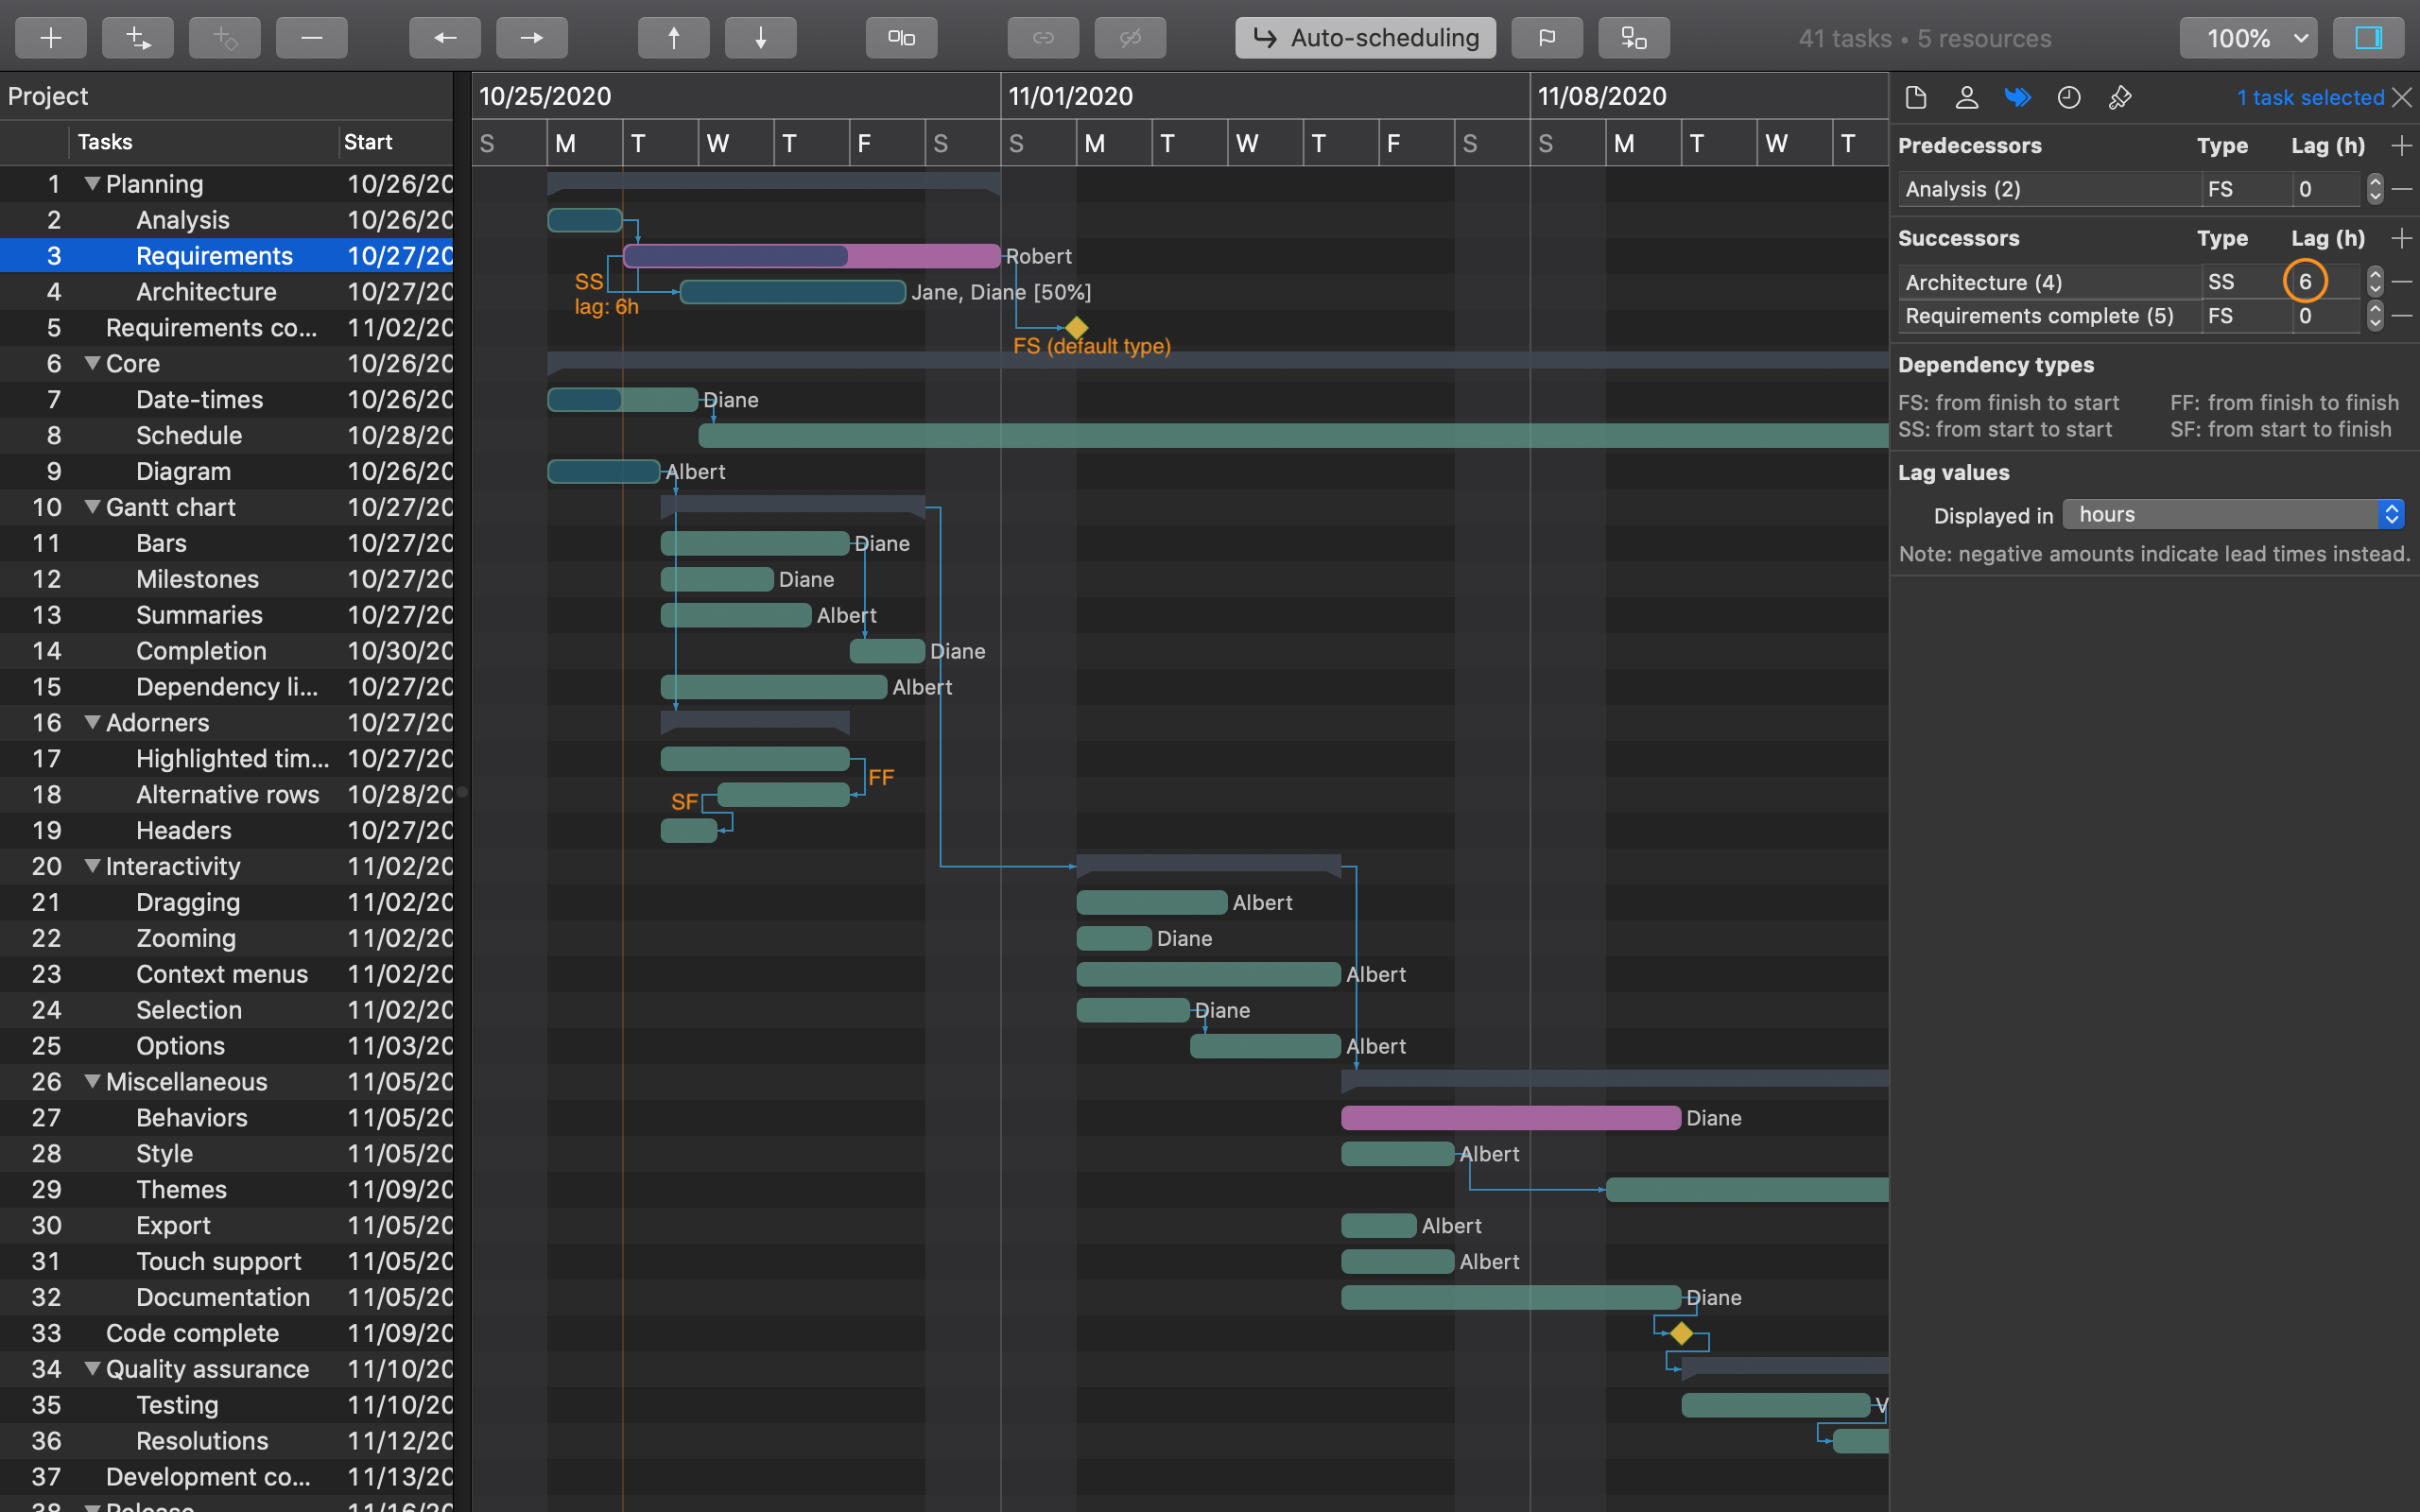
Besides editing the Predecessors field of a task in the Diagram inspector (which also supports entering lead or lag information by appending positive or negative values expressed in working hours or days, as configured), you can create dependencies between items by simply dragging to draw dependency lines from one bar to another directly in the chart area. To remove a dependency, use the Delete operation from the context menu of its line.
These dependency types are supported:
Alternatively, you can select two or more tasks in the left grid and click the link and unlink toolbar buttons to create (and remove) multiple finish-to-start dependencies between them.
You can also use the Dependencies inspector in the sidebar to manage dependencies for all tasks or for the current selection.
You can eventually turn on Auto-scheduling mode to ensure all dependencies are respected even when predecessor tasks are rescheduled.
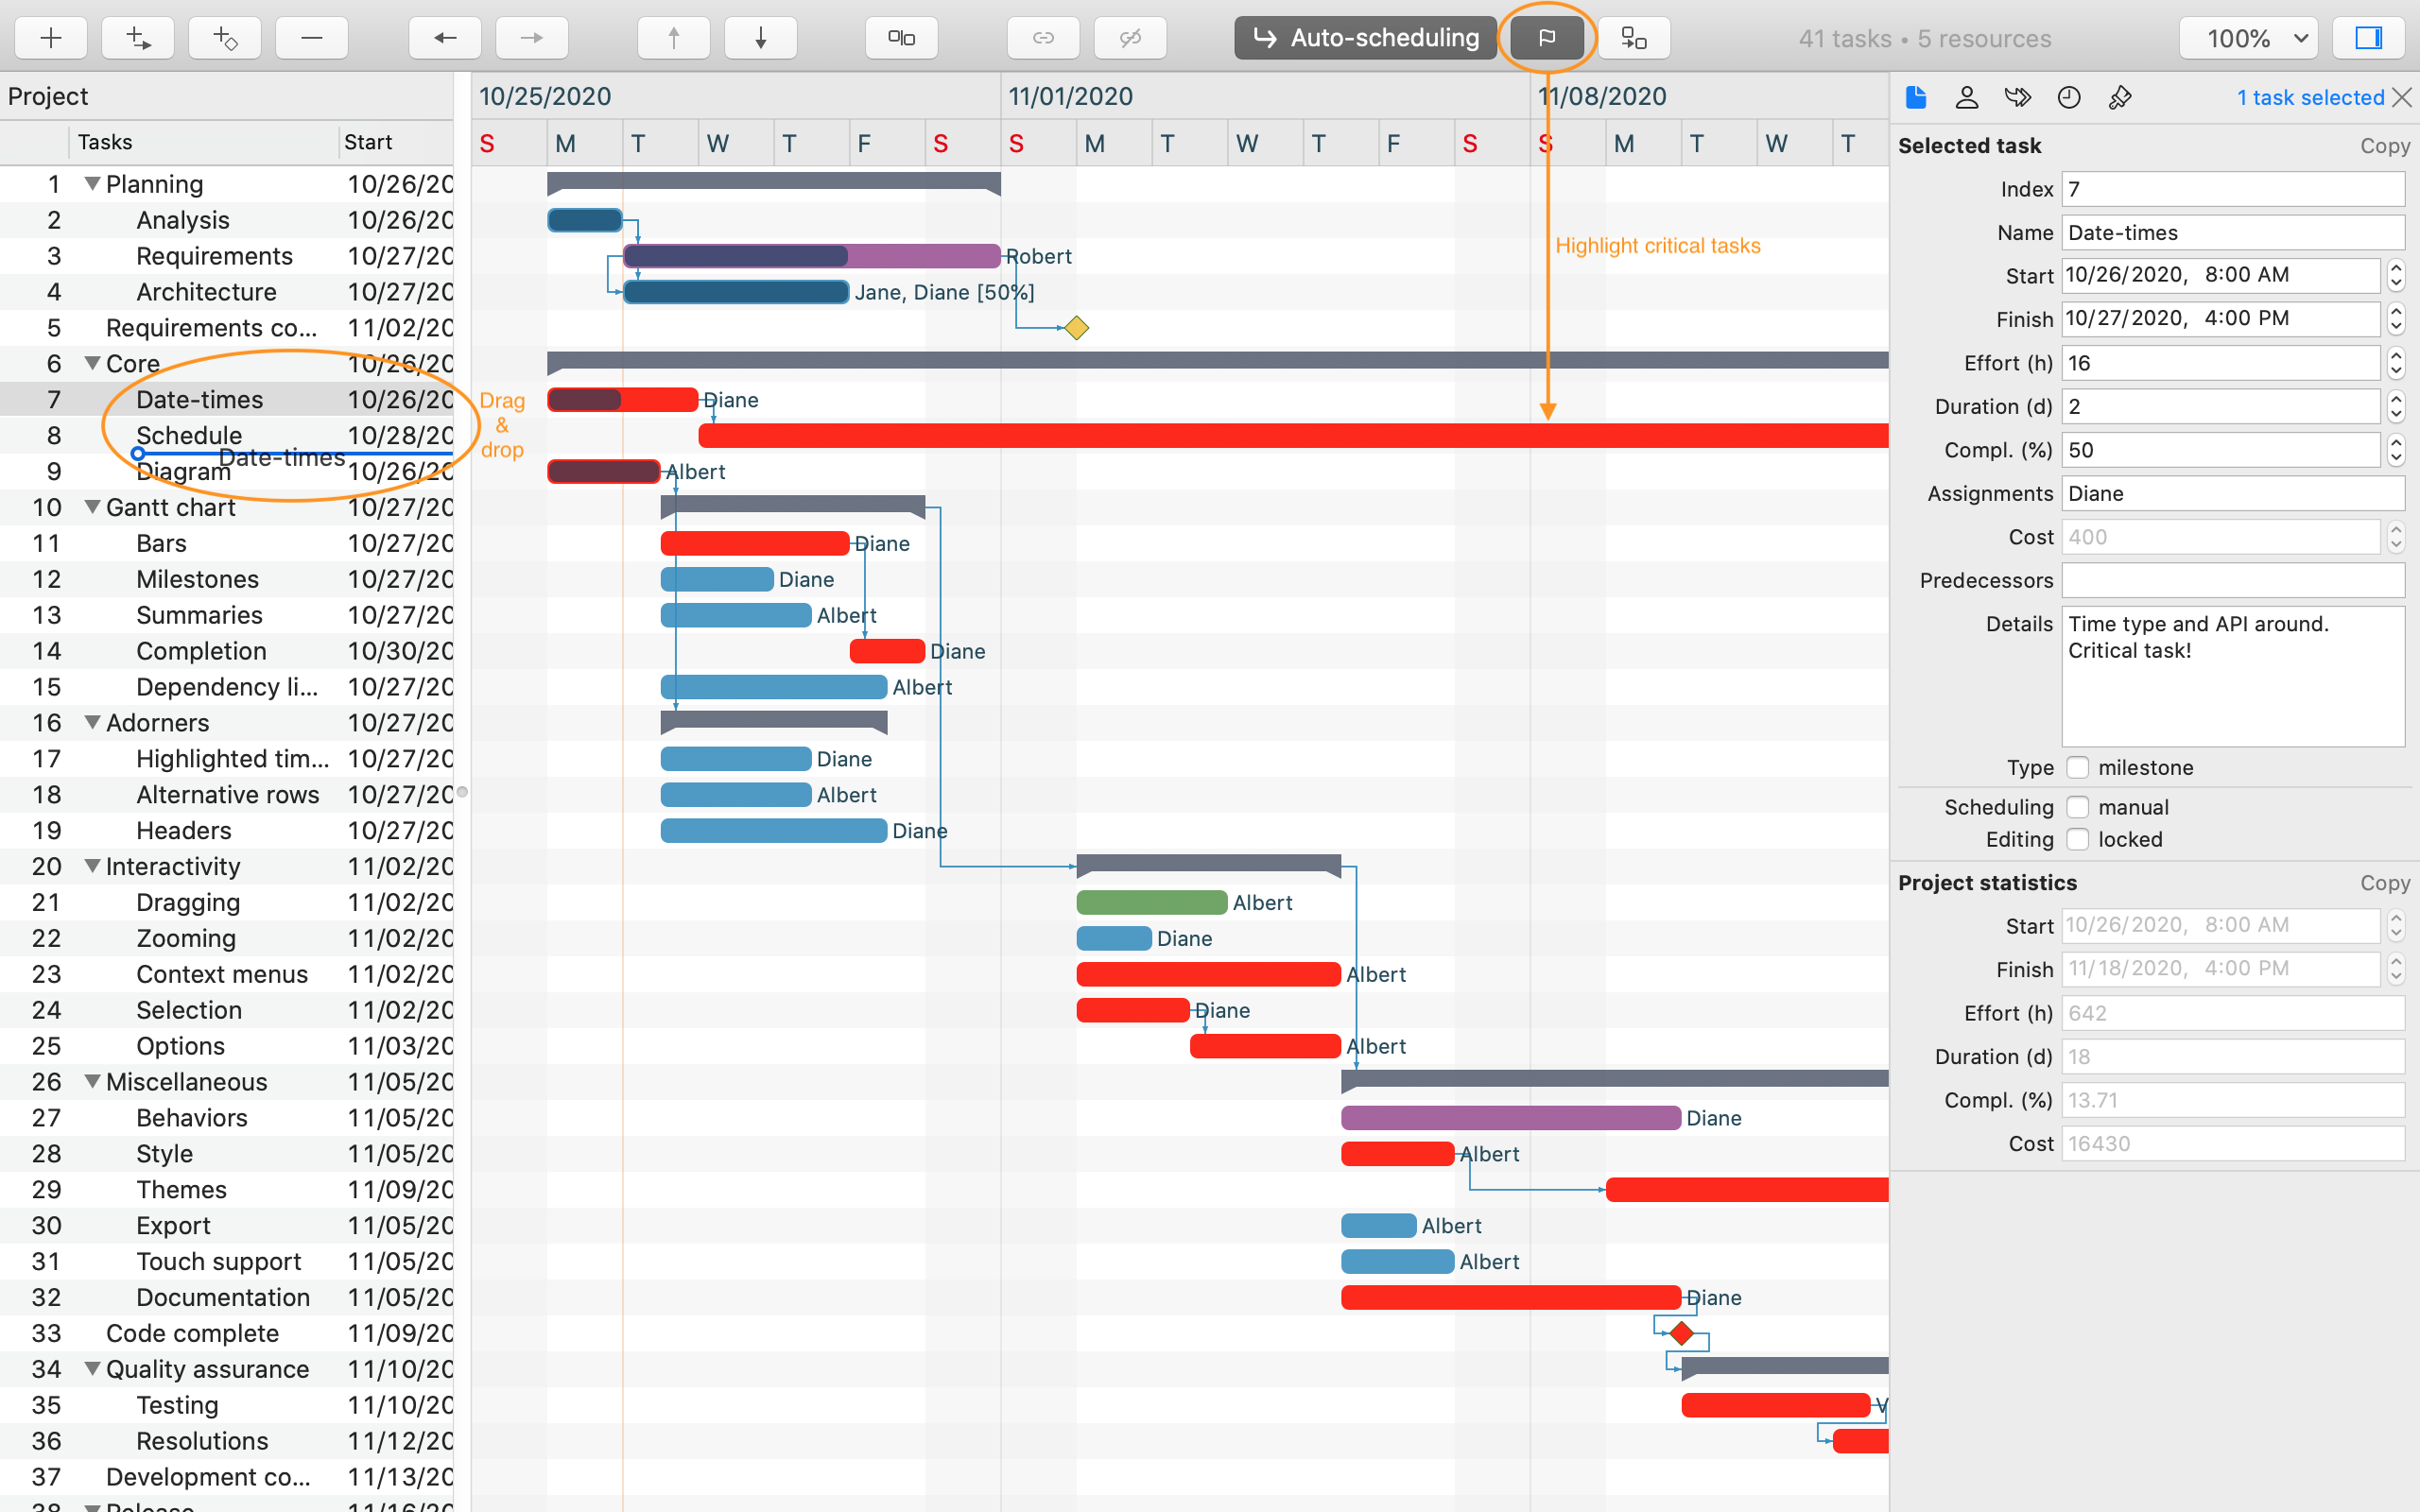
The project hierarchy can be easily updated, whenever needed, using vertical drag operations. Once the hierarchy is established, you can highlight critical tasks using the flag toggle button in the toolbar. And you can level resources to reschedule tasks and avoid over-allocation.
The main calendar defines working and nonworking time to be considered for all tasks that don't have specific calendars assigned, and it can be configured from the Schedule inspector.
A calendar is defined by these elements:
Individual tasks can have different calendars, though, and those will fully override the main calendar in respect to those items.
To define a special calendar for a task you would also need to use the Schedule inspector. Selecting a task in the left grid while the Schedule inspector is shown will change its user interface to allow you to select the Default calendar (main one), to select another existing one (such as already defined and used by another task), or to create one from scratch.
Note: if one or more calendars become orphanated (no tasks refer to them), a button appears at the bottom of the view, allowing you to clean them up automatically.
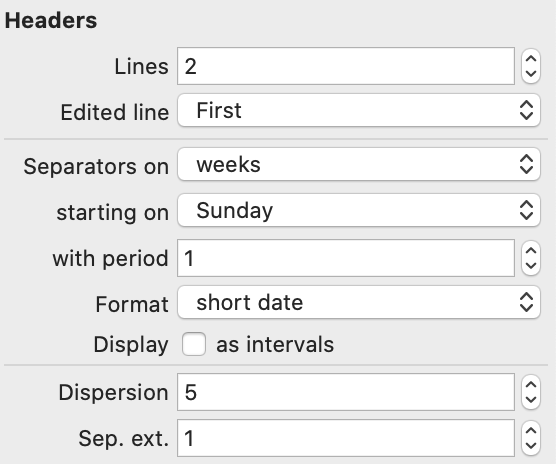
Depending on your specific needs, you can design the Gantt chart header area yourself. Using Diagram inspector when no task is selected, you can set the number of header Lines to use, and then customize the diagram by selecting each of them, repeatedly, as the Edited line and configuring it below in the inspector view.
For any individual header line selected for editing, these elements can be defined:
An example header with four lines (months, weeks starting on Monday using leading zero day number intervals, days of week, and periods of day) is presented below:
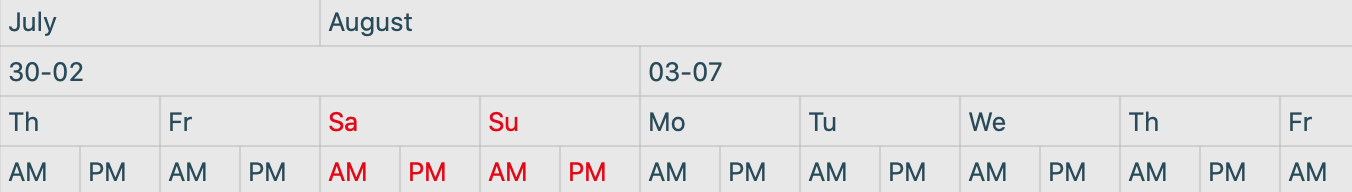
Note that when the last header line is edited and its intervals selection is updated, the intrinsic zoom level of the diagram is also changed to an appropriate value. You can, however, update Zoom factor field yourself too, whenever needed, afterwards.
And here is a special trick: you can easily select common header pairs from the context menu of the headers area itself!
Finally, separator extensions can also be configured as a number between zero and the number of header lines you have, meaning the number of header lines that should extend their separators below the header itself, under the main chart area.
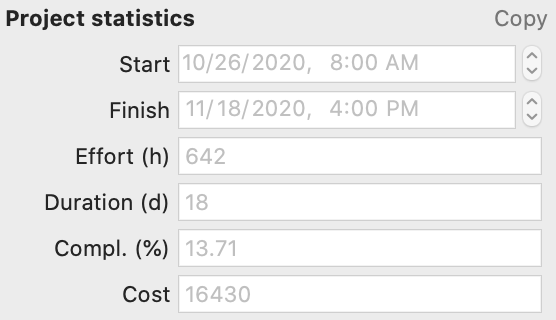
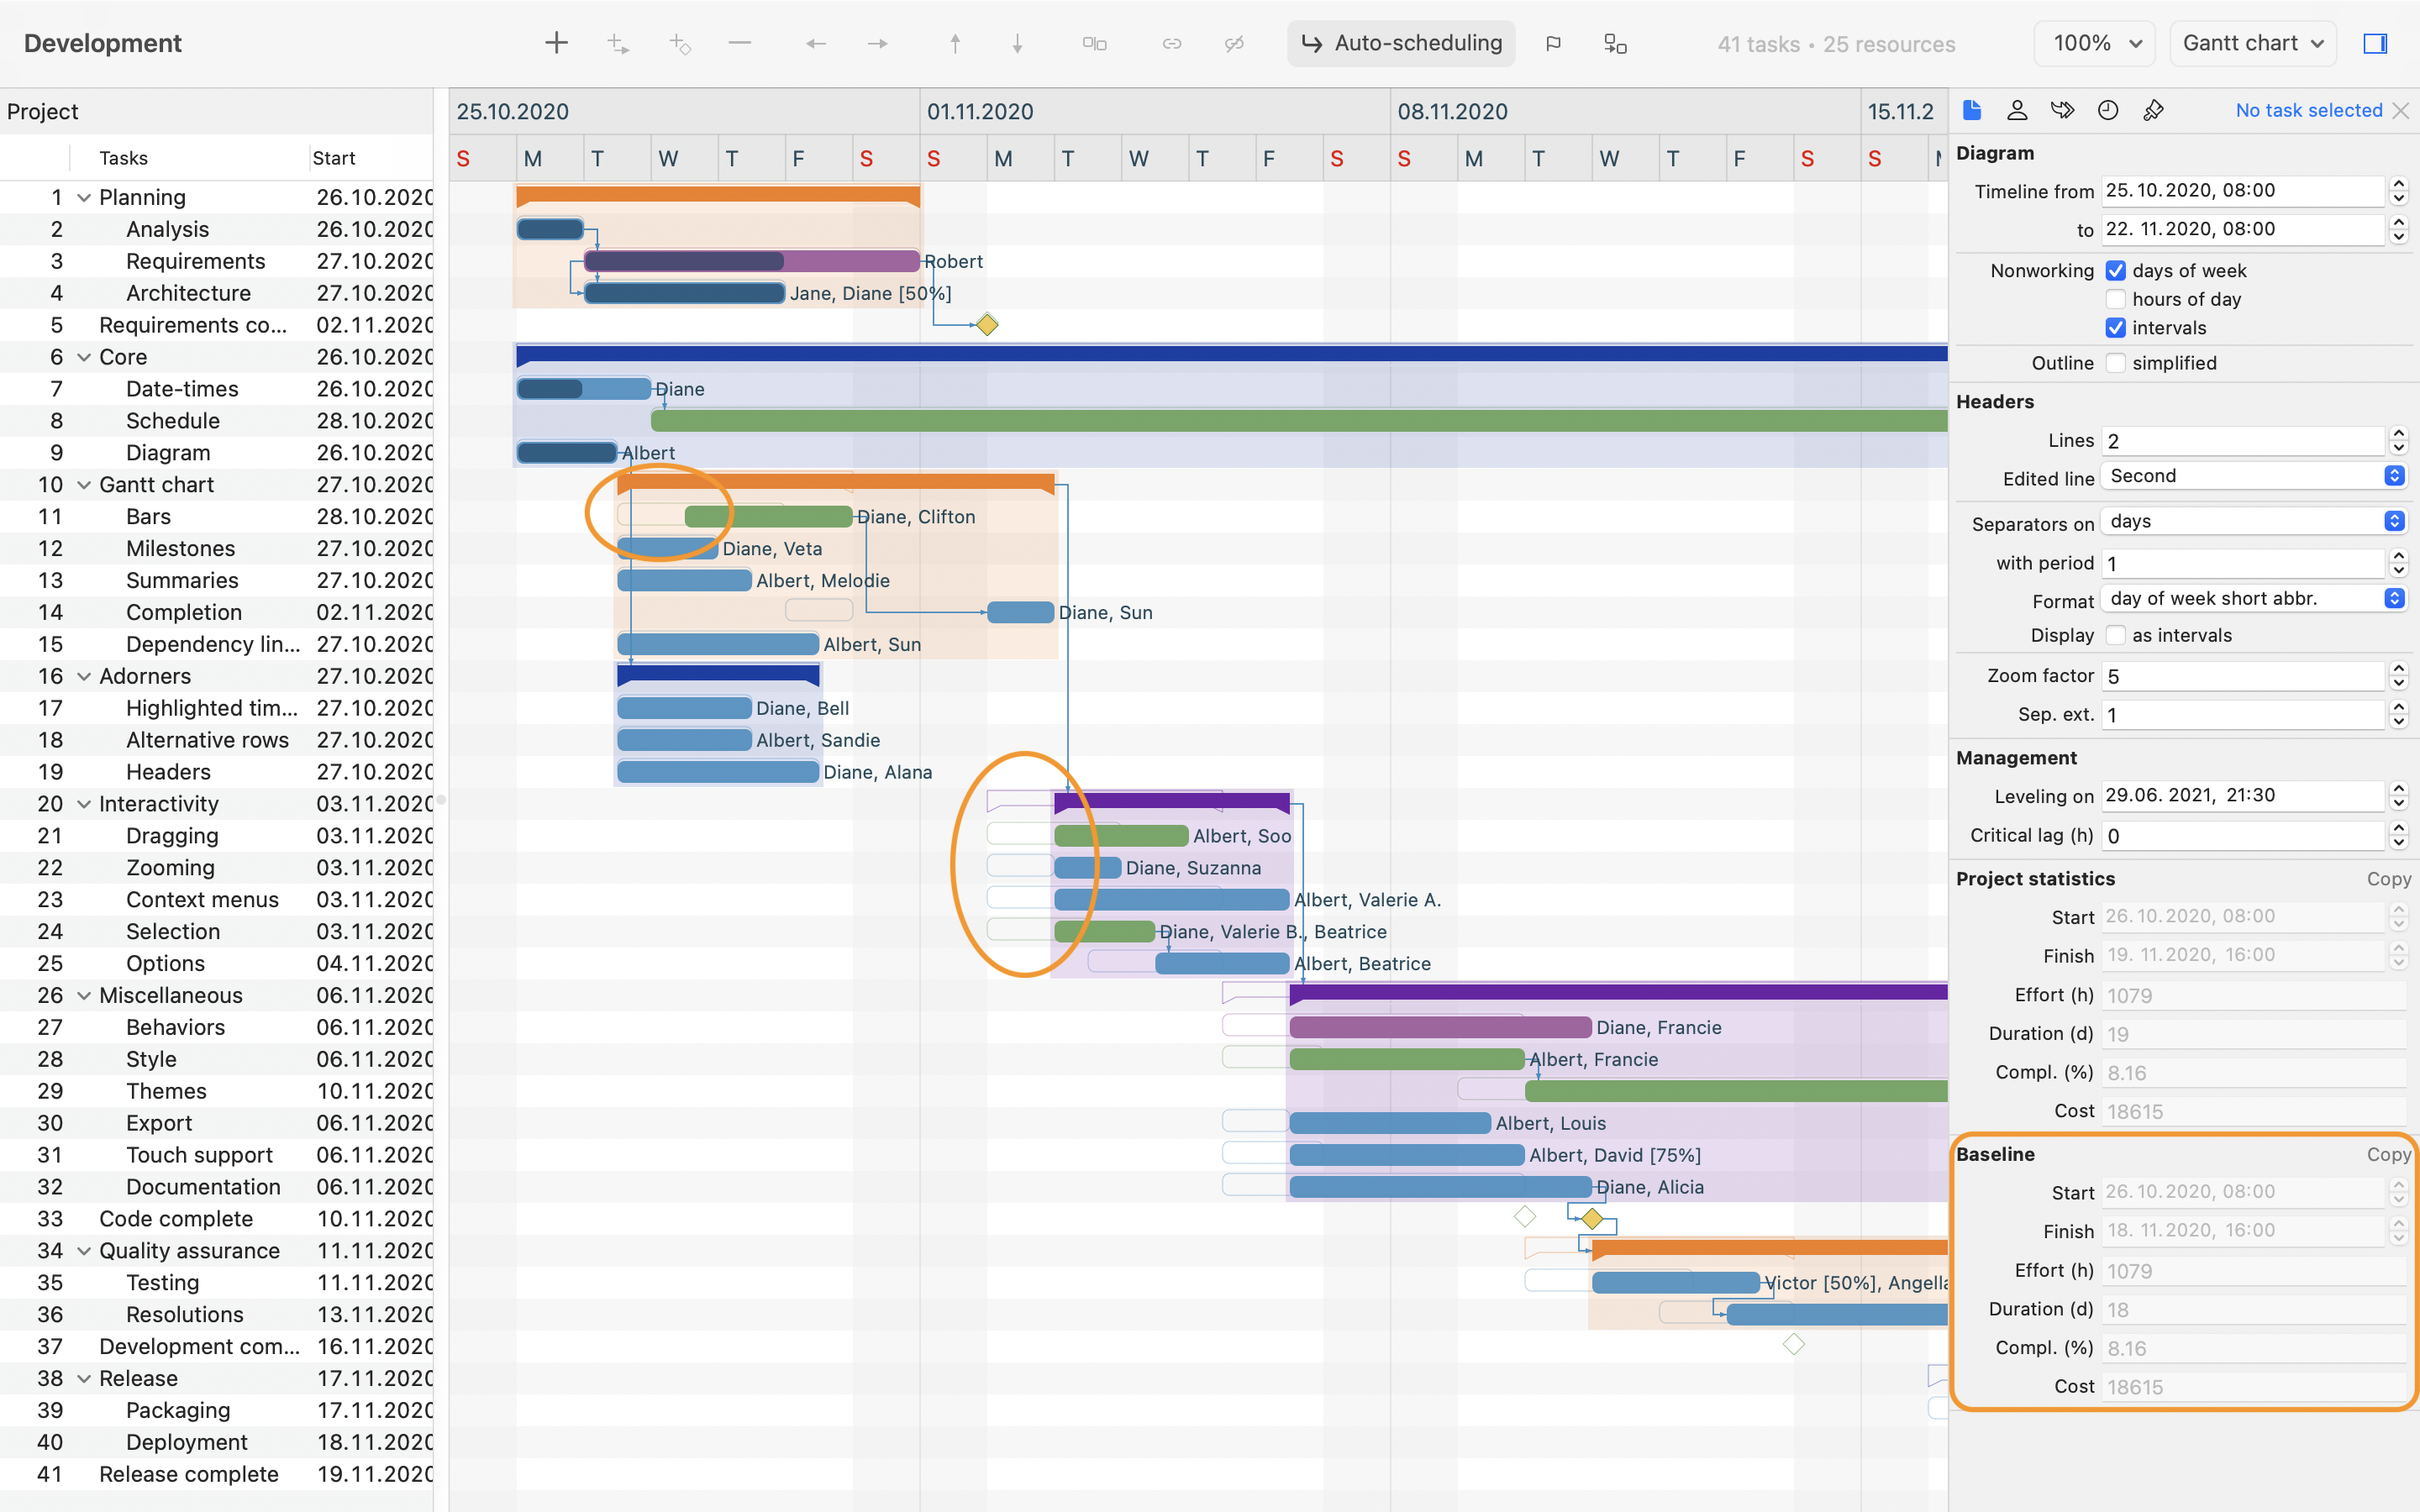
Although summary tasks can present information computed based on their child items directly in the left grid, to view summary information about the entire project you should go to the Project statistics section of the Diagram inspector.
The start and finish of the project, its total effort, duration, completion percent, and cost are displayed in the view for reference.
At any given time you can set up a project baseline from using Set Baseline command from the Project menu. You can then hide and show the baseline again using the Show Baseline command from the View menu. When the baseline is shown, each task has two bars in the Gantt chart: the actual one, and its baseline. And a Baseline section with relevant project level fields appears below Project statistics in the Diagram inspector.
The appearance of the diagram can be customized from the Style inspector:
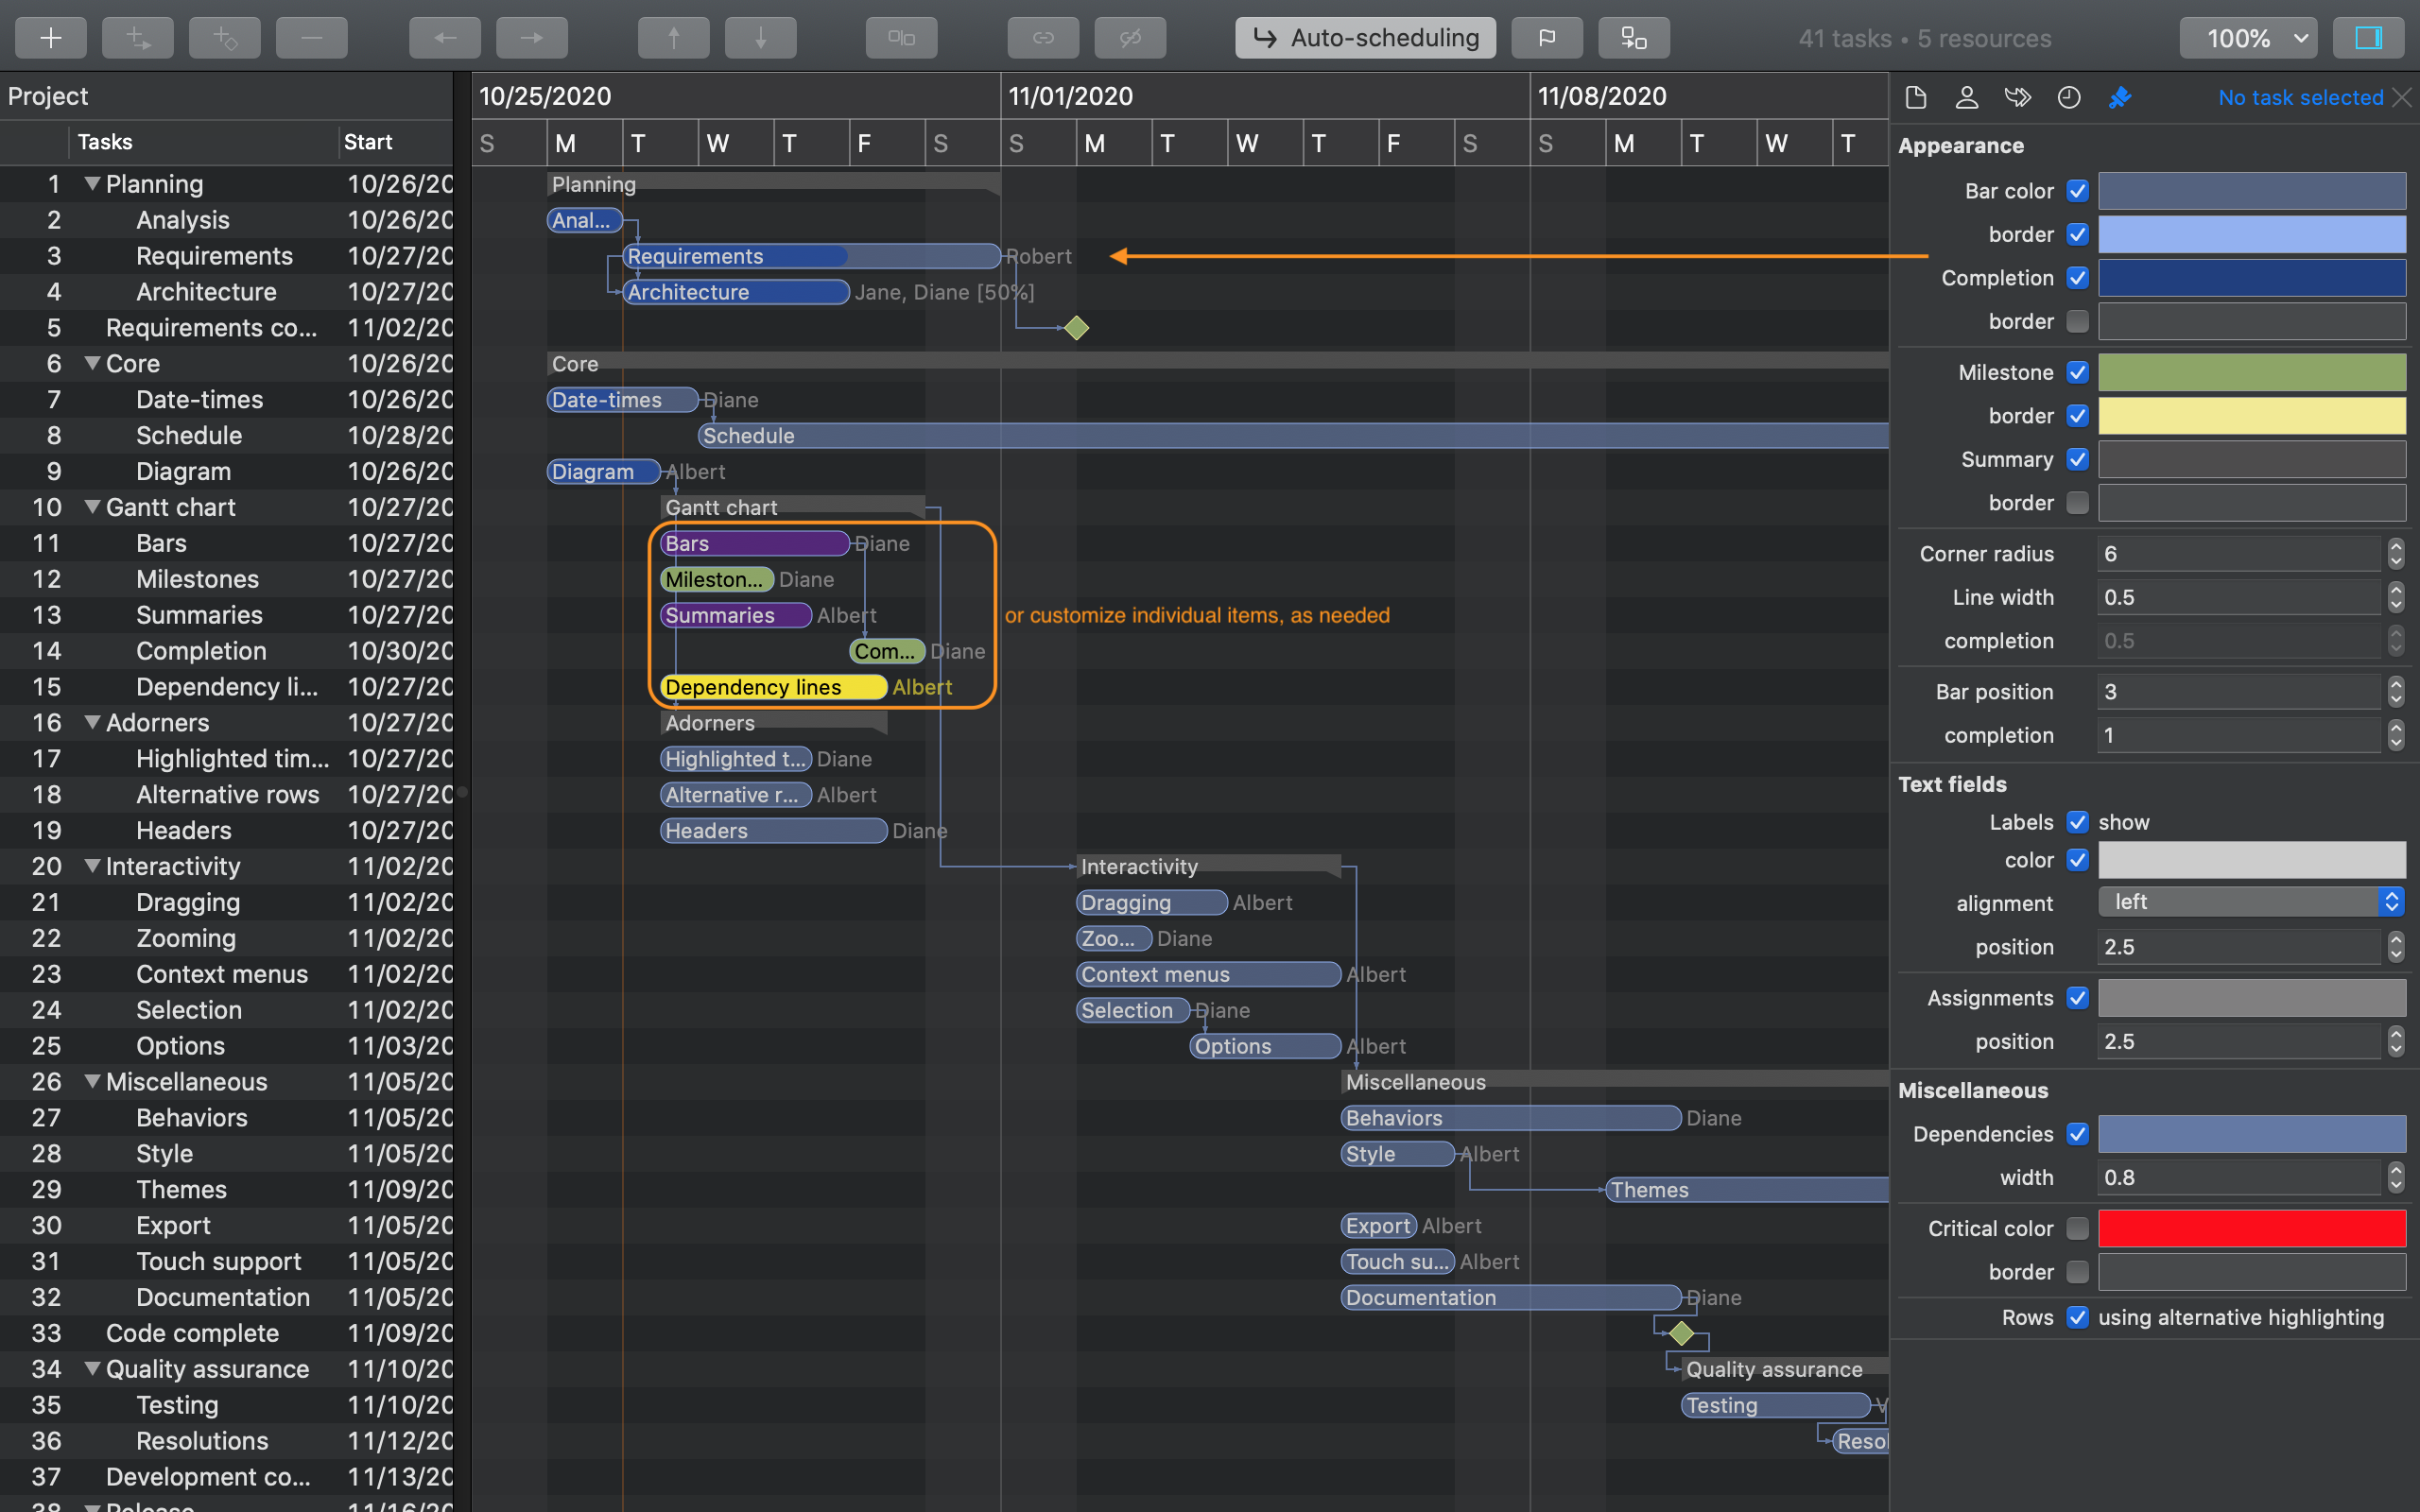
Individual tasks can have different styles, though, and those will fully override the main stylesheet in respect to those items for the item level-configurable properties.
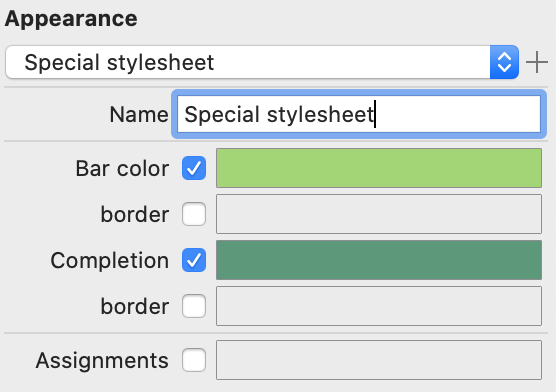
To define a special stylesheet for a task you would also need to use the Style inspector. Selecting a task in the left grid while the Style inspector is shown will change its user interface to allow you to select the Default stylesheet (main one), to select another existing one (such as already defined and used by another task), or to create an item level-specific one from scratch.
Note: if one or more stylesheets become orphanated (no tasks refer to them), a button appears at the bottom of the view, allowing you to clean them up automatically.
Besides saving and exporting projects as XML, you can also print them for further reference using Page Setup and Print commands from the File menu, and export them as PDF, image, text, TSV, and CSV formatted files using Export commands, too. Note that some of the project statistics are also included in the printed document (within the grid header area, above Start and Finish columns):
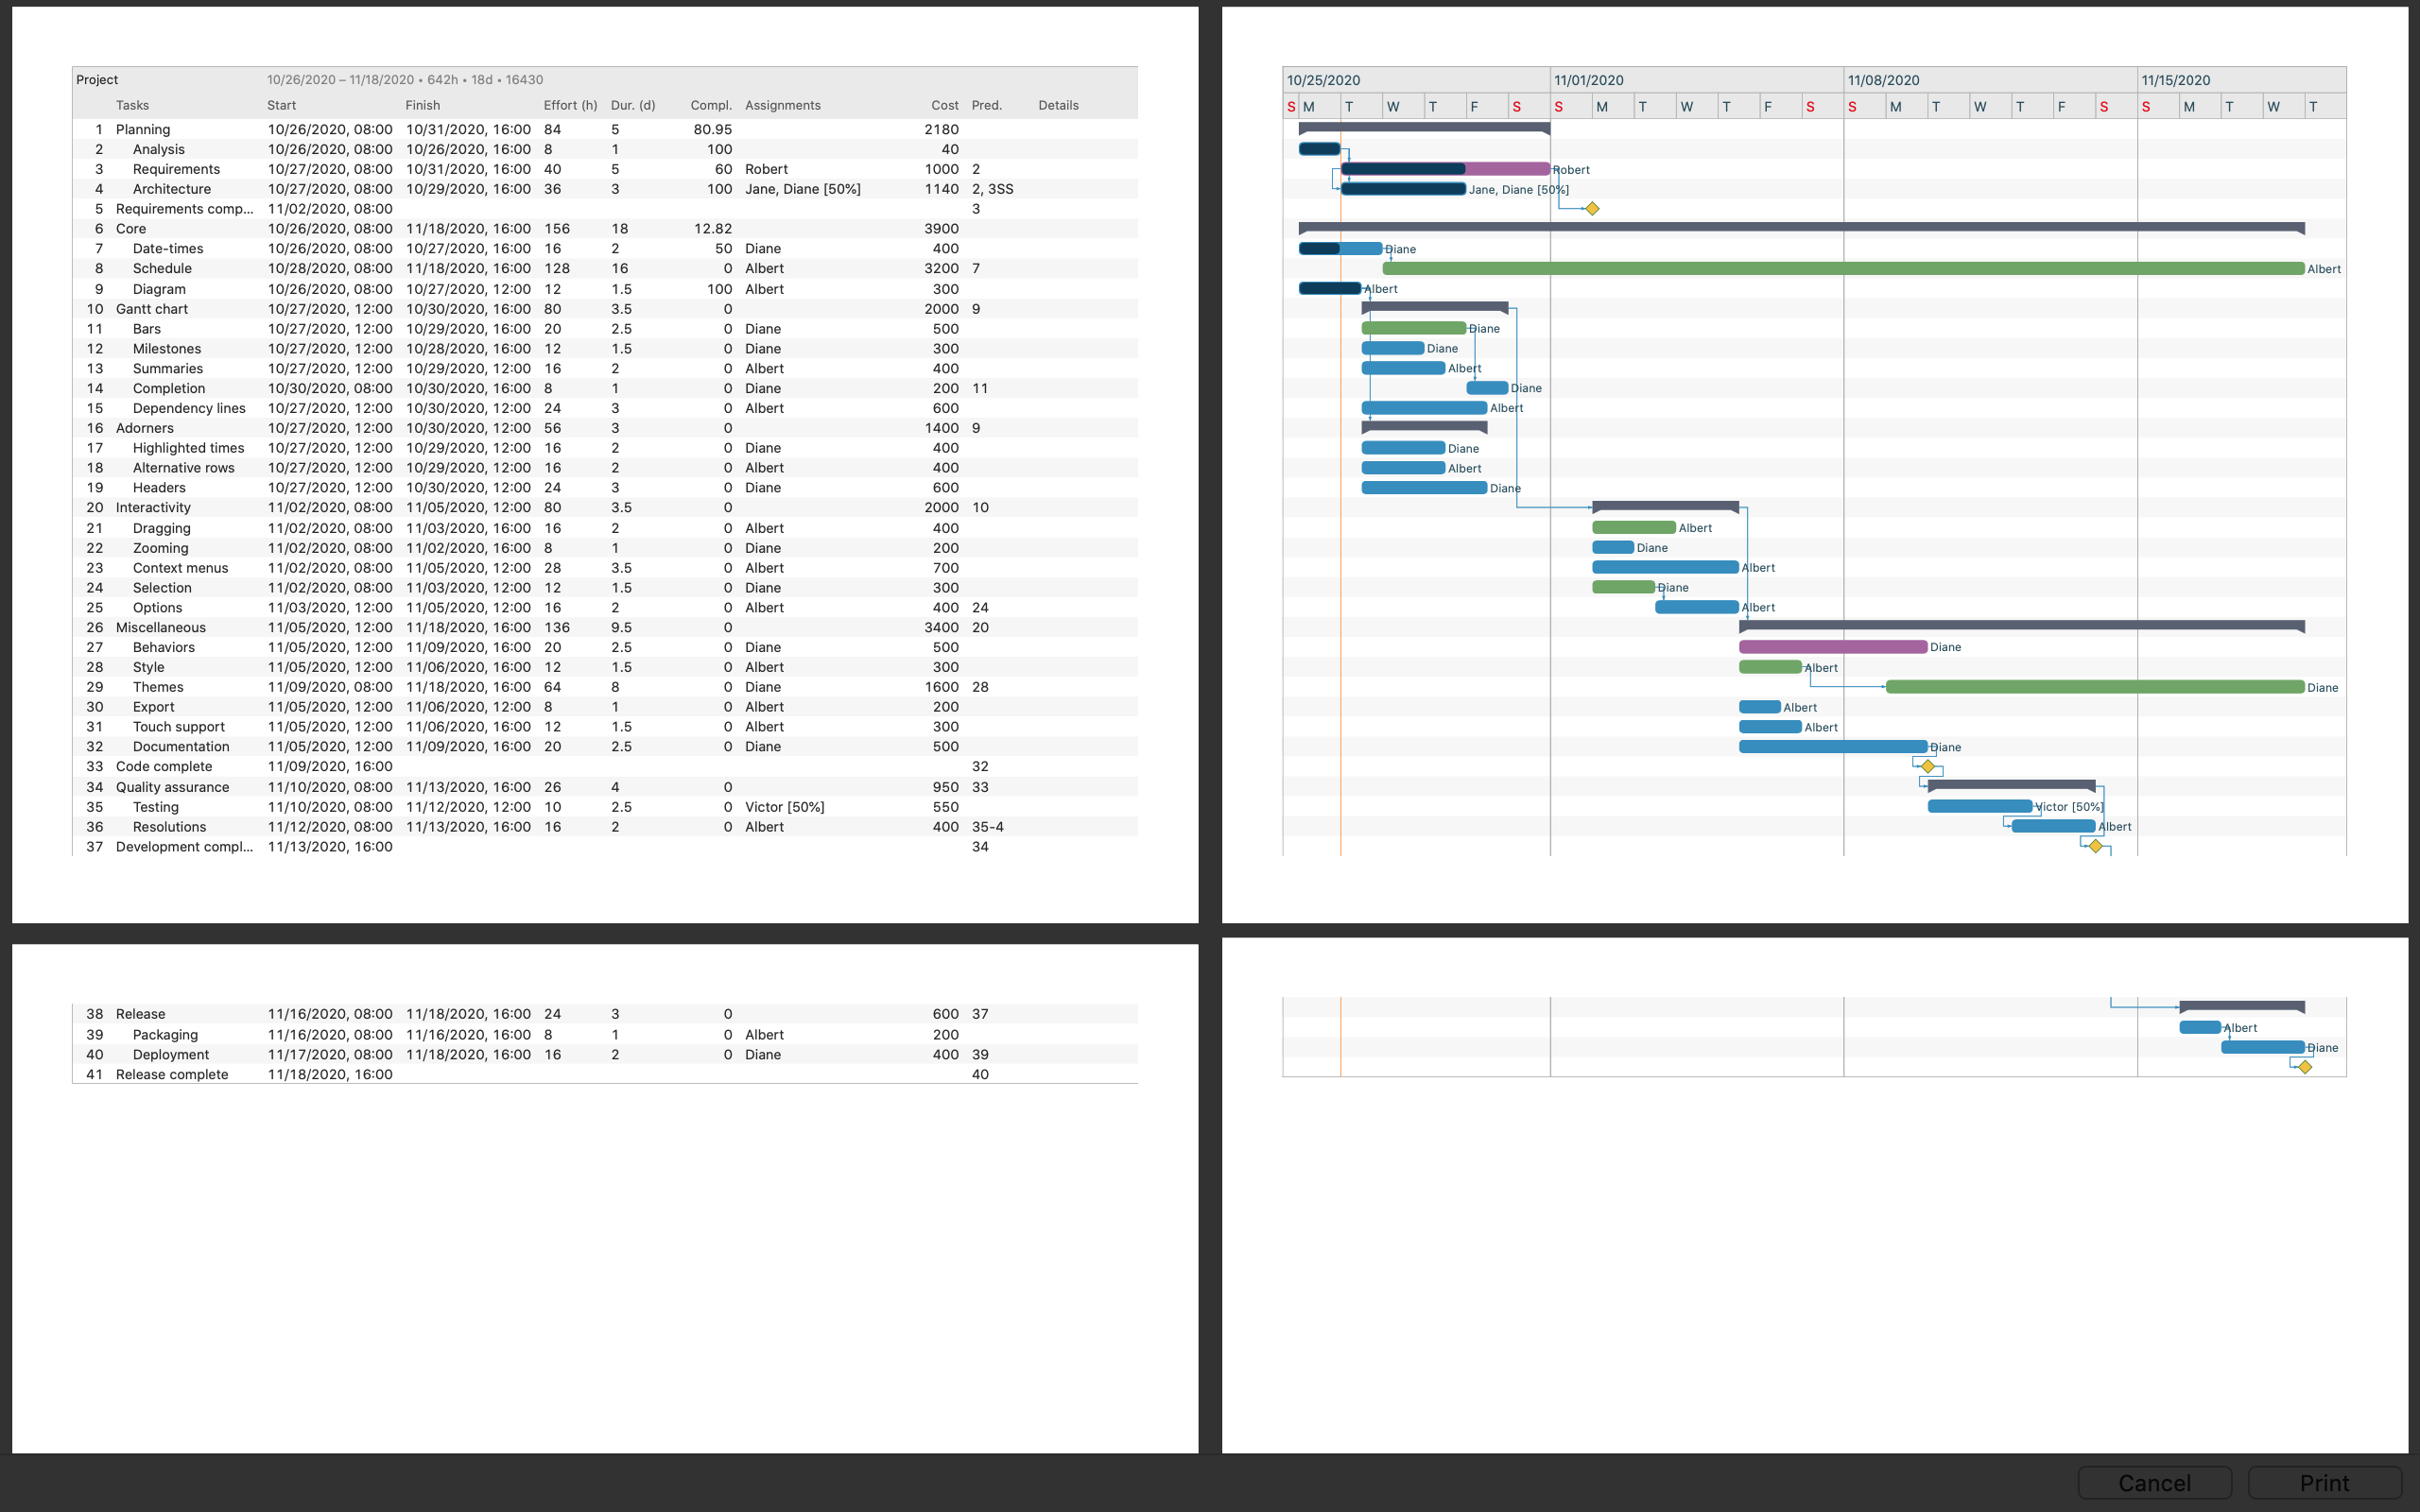
Note: If Load chart view is displayed, printing and exporting an image will use that diagram as input.